When you’re looking at a cryptocurrency price chart for the first time, it can be a little confusing. So many numbers, lines, and colors, can appear overwhelming initially. You may have heard people refer to “chart patterns” and various other cryptocurrency trading indicators that help traders and investors make choices based on the probability of outcomes, rather than gut feeling and chance. Crypto trading indicators are an essential tool for making the most out of the markets.
By collating dating points and determining probabilities, traders can make informed decisions. By using multiple cryptocurrency trading indicators in conjunction, the savvy trader is equipped to interpret market sentiment in a way that can maximize gains and minimize losses.
In this article, we’re going to look at the most commonly used trading indicators, and the functions they serve. Also, we’ll look at the benefits of on-chain analysis and explain how you can position yourself to stay ahead in the crypto markets by using the best crypto trading indicators available.
As the crypto markets are gathering some serious steam, it is more important than ever to understand how to take advantage of volatility, and how to avoid getting rekt. The Technical Analysis course at Ivan on Tech Academy is designed to teach you how to read market sentiment and make the most informed decisions possible when trading. Then, if you feel like taking your trading game to the next level, check out the Algorithmic Trading course at Ivan on Tech Academy to learn how to backtest your trading strategies and automate them to make money in your sleep!
What Are Cryptocurrency Trading Indicators?
Put simply, traditional trading indicators are tools used by traders to gauge market sentiment. Such indicators can be used in many different markets, such as for trading stocks, foreign exchange, and of course, cryptocurrency. While many crypto traders simply hodllong-term, trading requires a multitude of data points on which decisions are based. Trading on emotion is never a good idea. That’s why trading indicators have become an essential tool for all types of traders - include cryptocurrency traders. Cryptocurrency trading indicators are, therefore, simply regular technical analysis trading indicators in a cryptocurrency context.
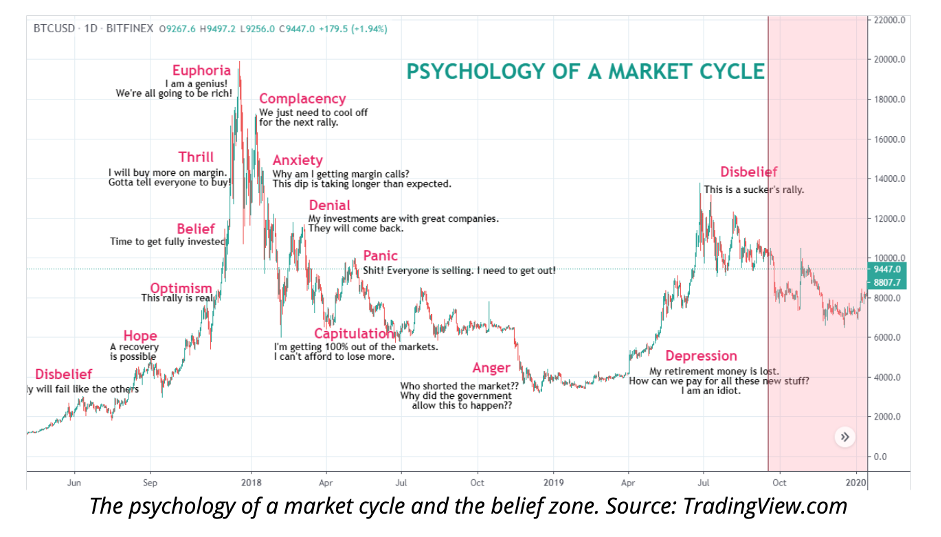
As an asset experiences extended upwards price movements, markets often view this as a signal that the asset is overbought. Equally, extended periods of downward momentum could indicate that an asset is oversold. These are often the type of signals that traders look for when entering markets.
When first attempting to understand crypto trading indicators, it is advisable to have a foundational knowledge of technical analysis. If you are new to trading, check out our article on Technical Analysis to familiarize yourself with some of the terminology and various concepts associated with cryptocurrency trading. Before that, however, let us first take a look at some of the most common trading indicators:
Trading Indicators
Moving Average (MA)
An asset’s Moving Average (MA), also known as a “simple” moving average (SMA), is a technical analysis indicator that can help to identify the future direction of a current price trend. As the name suggests, a moving average is a visualization of the average price movement of an asset over a specified period.
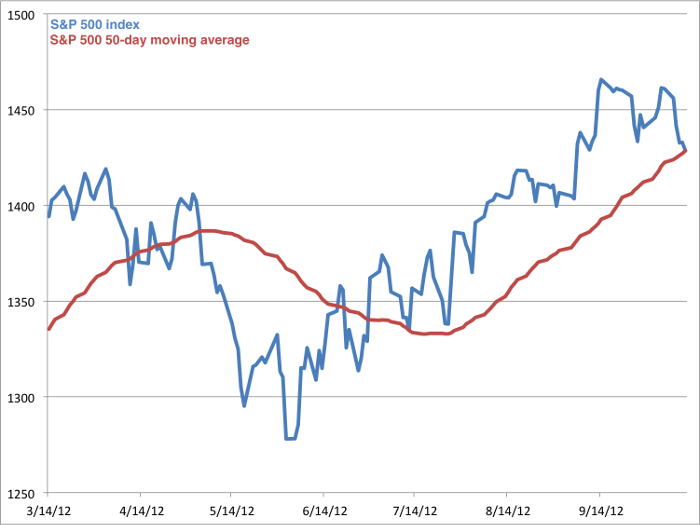
Moving Average Example
For example, a 21-day moving average has 21 days’ worth of data appearing as a line that corresponds with the average price action of an asset over the previous 21 days. This can also be customized for various timeframes. Moving averages are determined by taking the price points of each day within the specified period, and dividing the price points by the specified number of days over a given period.
Moving averages can indicate a change in sentiment, whether bullish or bearish. Also, moving averages often serve as support levels for crypto assets when prices fall. Many traders will look to moving averages as a price floor, from which the price of an asset may bounce, creating a price correction. Furthermore, the MA indicator can be used to assess historic levels of support and resistance and help predict future price movements. This provides a single trend line that doesn’t show short-term spikes and price fluctuations. Moving averages are one of the most commonly used crypto trading indicators on most price charts.
Exponential Moving Average (EMA)
The exponential moving average (EMA) works in a similar way to the simple moving average (SMA). However, the distinction between the two, is that the EMA is more responsive to recent information, placing greater emphasis on recent data points. As with the SMA, EMAs assist traders in predicting market moves.
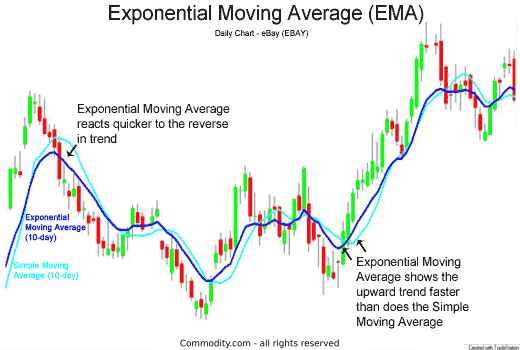
Just as SMAs can be customized over multiple timeframes, so too can EMAs. This gives traders an insight into the averages of both short-term and long-term price movements, which can serve as an extremely useful crypto trading indicator.
Moving Average Convergence Divergence (MACD)
Another popular trading indicator is the moving average convergence/divergence (MACD). The MACD compares two different moving averages simultaneously. This can help draw a trader's attention to changes in momentum within a market to outline potential buying and selling opportunities at critical support and resistance levels.
When two moving averages converge, they move toward each other. However, when two moving averages diverge, this means they are moving away from each other. Convergences in these moving averages indicate a decrease in momentum, while divergences indicate an increase in momentum. An increase in momentum is often seen as a bullish signal, while a decrease can be seen as bearish.
Bollinger Bands
Created by John Bollinger, Bollinger bands are used to determine the price range that an asset typically operates within. The volatility of an asset’s price can be observed with the expansion and contraction of these bands. As the bands move together, becoming narrower, the perceived price action of an asset is lowered. This often signals a lower probability of volatility. Conversely, when these bands become further apart, the market anticipates greater volatility.
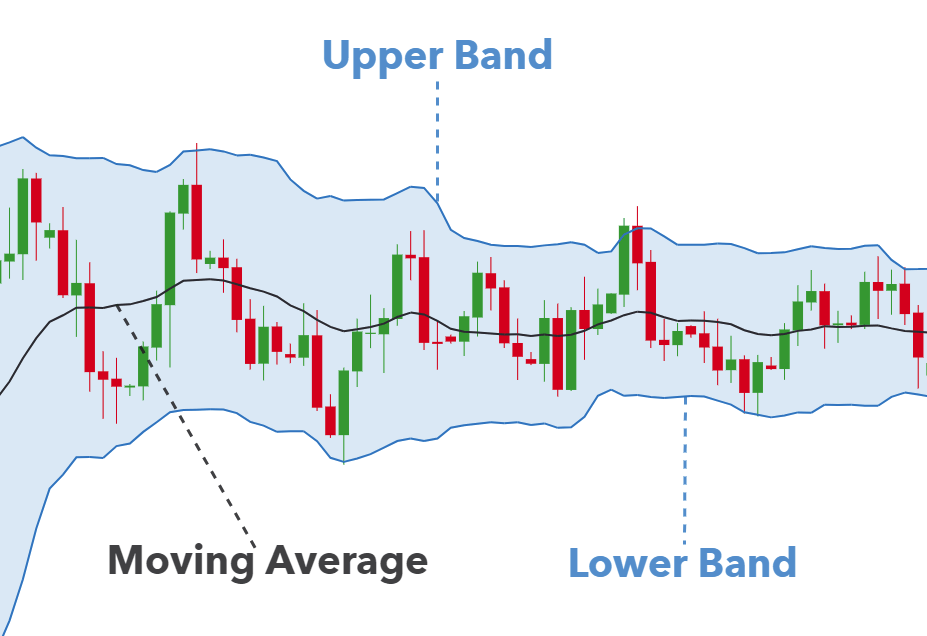
If an asset tends to move within a particular range, Bollinger bands are a useful indicator when the price of an asset moves outside of this range. Bollinger bands are often used to forecast long-term price movements. When the upper-limits of the band are surpassed by an asset frequently, it could suggest that the asset is overbought. Similarly, an asset moving below the bottom band could be oversold.
Relative Strength Index (RSI)
The relative strength index (RSI) is expressed as a figure ranging between 0 and 100. The RSI is an essential crypto indicator for establishing warning signals and shifts in momentum within a market that could be potentially dangerous. Often, an asset above 70 on the RSI scale is perceived to be overbought. Conversely, assets that fall towards 30 on the RSI scale are often seen as oversold.
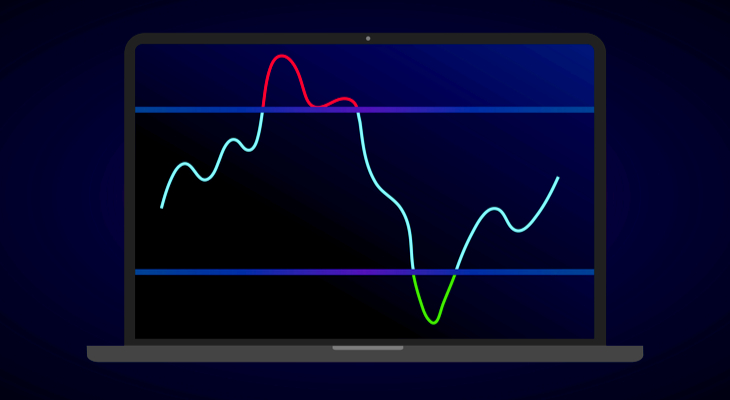
When a signal suggests that an asset is overbought, it indicates that short-term gains could be coming to an end, and a price correction may be due. On the other hand, when a signal suggests that an asset is oversold, it indicates that short-term downward momentum could be coming to an end, and a move to the upside may be approaching.
Fibonacci Retracement
The Fibonacci retracement indicator is used to forecast the extent to which an asset could move from its current price. A retracement is a short-term dip. The Fibonacci retracement indicator can help traders to identify potential support and resistance levels that may indicate a trend change. This tool is often used by traders as a way to determine stop-losses and where to open and close trading positions.
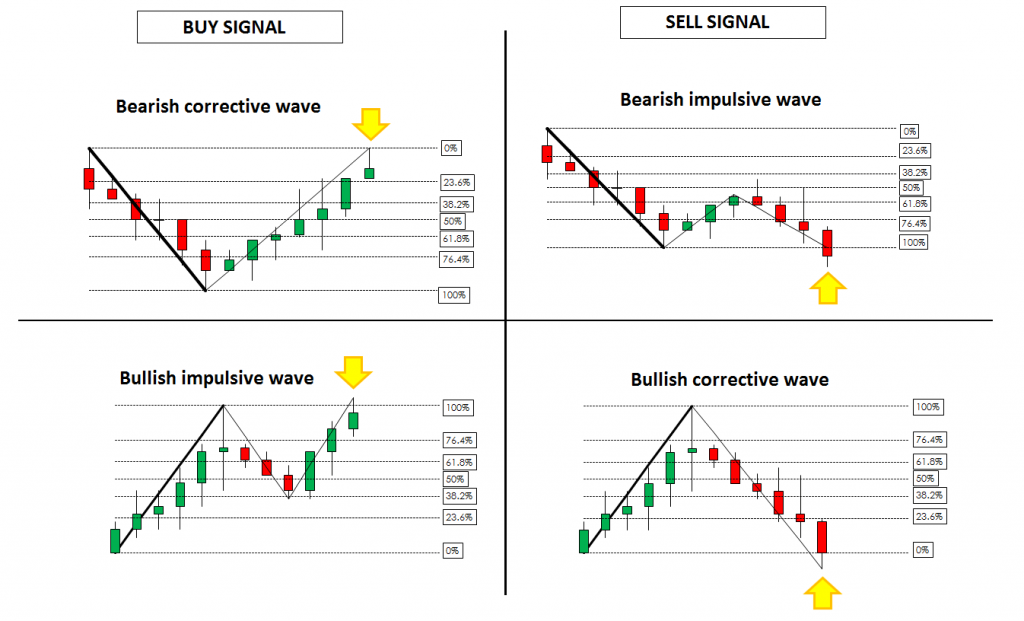
Examples of Fibonacci Retracement Trends
Fibonacci retracements are particularly useful during price discovery. When there is no historic data to compare to current market conditions, the Fibonacci retracement becomes an essential tool for establishing potential price targets, making it one of the go-to cryptocurrency trading indicators for many traders.
Ichimoku Cloud
The Ichimoku Cloud is an all-in-one indicator used by many traders. ‘Ichimoku’ is a Japanese word that translates to ‘one-look equilibrium chart’. Traders often use the Ichimoku Cloud to observe multiple indicators within a single visualization to aid with quick decision making. Essentially, the Ichimoku Cloud spots changes in price momentum and can be useful for establishing potential future support and resistance levels.
To fully appreciate how blockchain is changing the face of global finance, it’s important to know where we came from and how money has evolved over time. If cryptocurrency and blockchain have sparked your enthusiasm for learning about the history of money, we highly suggest you check out the Bitcoin Standard Course at Ivan on Tech Academy!
On-Chain Analysis
For many years, technical analysis (TA) has been among the most highly regarded tools for traders. However, as the blockchain industry has blossomed, so too has the expertise in on-chain analysis. On-chain analysis provides various data points for trading that are simply not afforded by TA.

Glassnode is perhaps the most popular on-chain analysis suite available for crypto trading indicators. The platform provides insights into blockchain activity that give crypto traders the upper-hand when timing the markets. Though there are various on-chain metrics available, below are some of the most commonly used on-chain cryptocurrency trading indicators.
Net Unrealized Profit/Loss (NUPL)
Developed by Tuur Demeester, Tamás Blummer, and Michiel Lescrauwaet in February of 2019, Net Unrealized Profit/Loss (NUPL) is one of the most valuable on-chain cryptocurrency trading indicators available to date. NUPL looks at the variation between the price of an asset when it was first purchased compared to its current price. This is how traders can establish if assets are in a state of net loss or net profit. Furthermore, NUPL can identify if an entire network is in a state of net profit or loss.
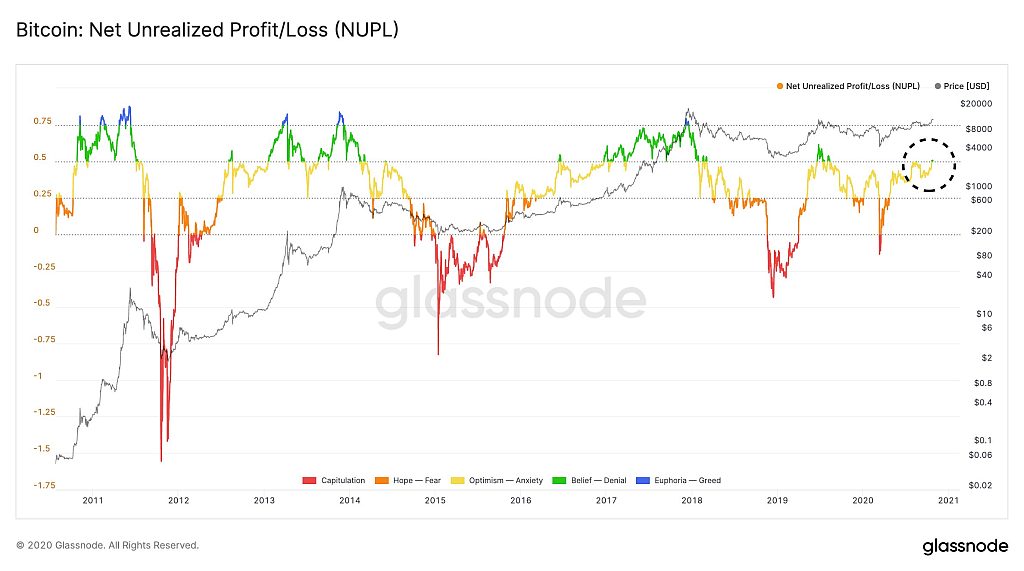
This crypto trading indicator is best applied to Bitcoin as a way of determining tops and bottoms in the market. NUPL values above zero show that the network as a whole is in profit. Values below zero show an overall net loss. As a rule of thumb, the greater the NUPL deviates from zero, the higher the probability of the market reaching peaks and bottoms.
Therefore, NUPL is a great tool for timing entry points when trading cryptocurrency. When the NUPL indicator reaches blue, the market is probably near its peak. This can be a useful indicator of when to take profits. Similarly, when NUPL reaches red, this could indicate a re-entry point.
Entities In Profit
In case you hadn’t guessed it, entities in profit refers to the number of wallet addresses that hold assets that are currently in profit. The reason this metric is important is that when everybody is in profit, the probability of a sell-off increases. During all-time highs, it’s easy to sit back and enjoy the euphoria. However, it’s important to consider that when this metric is too high, the chances of a price correction usually increases.
Exchange Inflow/Outflow
Exchange inflows and outflows are also particularly useful on-chain cryptocurrency trading indicators. These metrics allow traders to see when new coins or tokens enter circulation, and when new stablecoins are created. Furthermore, this enables anybody to see when whales deposit large amounts of funds onto crypto exchanges to dump them. Also, this metric shows the supply and demand for crypto assets which can indicate potential price movements.
New Addresses
As the name suggests, this metric tracks the number of new crypto wallet addresses. This is one of the easiest ways to monitor the expansion and adoption of a blockchain. Although not all new addresses belong to a new user, this is still an important on-chain metric. This indicator is often used to document the network effect of cryptocurrency and blockchain adoption.
Active Addresses
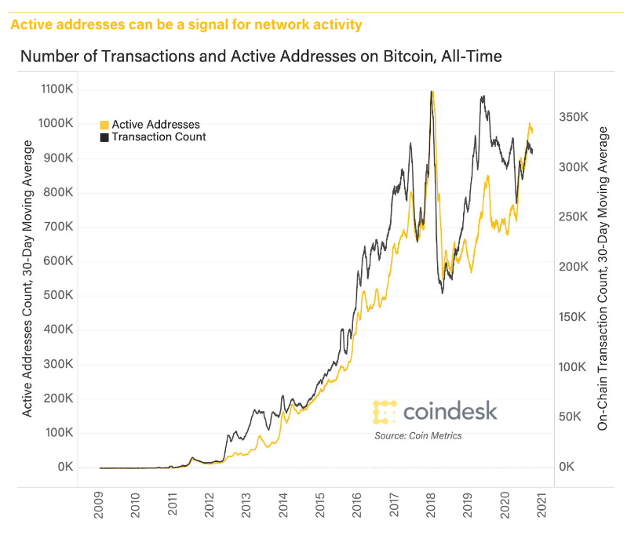
As opposed to new addresses, the active addresses metric is used to observe network activity. Many crypto investors hodl assets for several years. During these periods it is only natural that network activity decreases. As such, when more addresses become active, the higher the probability of assets becoming active in the markets again.
Bitcoin Strength Index (BSI) Indicator - The Best Indicator For Cryptocurrency Trading?
The Ivan on Tech Bitcoin Strength Indicator (BSI) is the ultimate tool to gain an unfair advantage in the markets. By combining technical analysis (TA) and on-chain analysis, the BSI Indicator empowers traders with all of the information available to make the correct decisions consistently throughout the potential 2021 bull run. In fact, the fact that the BSI Indicator combines data from both technical analysis and on-chain analysis arguably makes it one of, if not the, best indicator for cryptocurrency trading. Although the best cryptocurrency trading indicator for you may be subjective, the fact that the BSI Indicator recently predicted Bitcoin’s January dump lends it some credence.
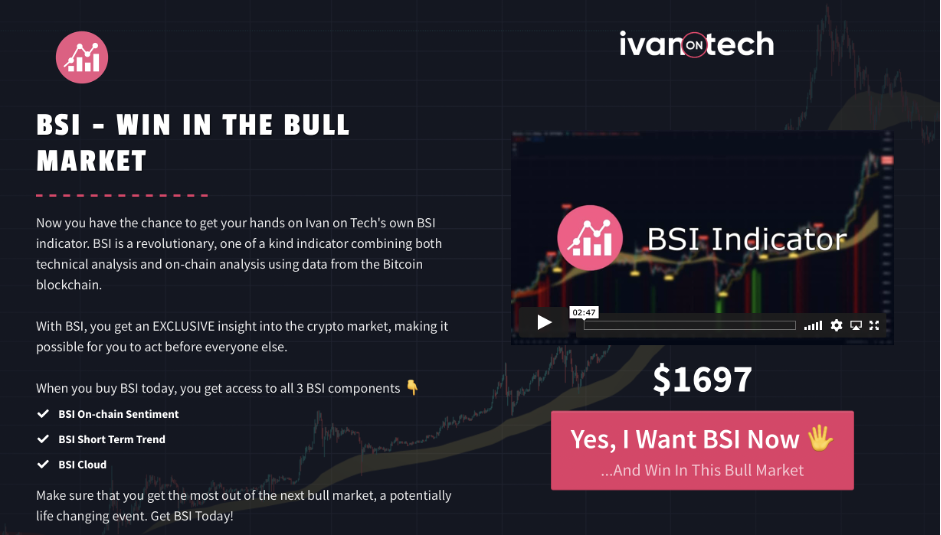
The Ivan on Tech BSI Indicator allows you to make the most of the volatility in the markets, rather than shying away from it. Many traders and investors see volatility as something to be avoided. However, with the BSI Indicator, you can use the volatility of the market to your advantage by being able to act before the majority.
The Ivan on Tech BSI Indicator removes the need for juggling multiple crypto trading indicators by combining three core elements into one simple trading tool:
BSI On-Chain Sentiment
Firstly, the BSI On-Chain Sentiment indicator shows you when the market sentiment shifts. This enables you to see exactly what is happening on-chain and in the crypto markets before it has an impact on the charts.
BSI Short-Term Trend
Secondly, the BSI Short-Term Trend gives you a clear indication of when a short-term trend changes from bullish to bearish, and vice-versa. This enables you to make informed decisions before the majority in the market have time to act.
BSI Cloud
Finally, the BSI Cloud gives a longer-term visualization of the strength of the Bitcoin market that can help inform a trading strategy and any changes that might need to be made to it.
For the most cutting-edge and advanced trading experience available, the Ivan on Tech BSI Indicator is a must! This essential tool combines key elements of both technical analysis and on-chain analysis into a single, comprehensive crypto trading indicator. Also, the BSI Indicator makes it easy to see multiple data points from various sources, all in one location! This is a game-changer for traders, as the Ivan on Tech BSI Indicator is integrated with TradingView for a seamless trading experience.
Crypto Trading Indicators Summary
Sometimes, trading is compared to gambling. For those that invest blindly into an asset without research or concern of market conditions, this may be the case. When due diligence, technical analysis, and fundamental analysis are thrown to the wind, one might as well be in a casino. Therefore, the highest quality crypto indicator can be the difference between life-changing gains and missed opportunities.
There are a wide variety of crypto trading indicators out there, displaying a vast array of metrics. Often, traders will use multiple trading indicators to gain a fuller all-round perspective of market sentiment.

Having a crypto trading strategy and using cryptocurrency trading indicators is paramount to success in crypto. With the Ivan on Tech BSI Indicator, you can be a step ahead of the market at all times. Also, the BSI Indicator helps you execute trades based on hard data, removing emotion from the equation.
If you want to learn more about the fundamentals of crypto and blockchain, be sure to check out the Crypto Basics course at Ivan on Tech Academy. Regardless of your current level of experience, Ivan on Tech Academy has courses that explore every part of the blockchain industry. These include Ethereum Smart Contract Programming 101, Bitcoin and Blockchain 101, and Fintech 101, plus much more!
Are you already using the Ivan on Tech BSI Indicator to make the most of the crypto markets? Follow the Ivan on Tech Academy Twitterto let us know how your trading game has evolved!
