All traders are, whether they know it or not, in constant competition with one another. However, short-term investing is not a level playing field. Certain traders gain an unfair advantage through having access to better information than others. When it comes to trading, the old adage ”knowledge is power” still rings true. Although no serious trading tool can guarantee risk-free profits, having access to the most relevant trading information means you can base your trading strategies on accurate trading intelligence and maximize the probability of your strategies succeeding. This is where the Ivan on Tech BSI Indicator comes in.
For decades, Technical Analysis (TA) was seen as one of the best tools for getting a leg up on most other traders in traditional financial markets. With the advent of the cryptocurrency market, so-called ”On-Chain Analysis” – or simply ”blockchain analysis” – gave traders access to blockchain fundamentals that could similarly help them hone their trading strategies. Nevertheless, this often meant traders had to choose between focusing on either Technical Analysis or On-Chain Analysis.
The Ivan on Tech Bitcoin Strength Index Indicator, or BSI Indicator, reimagines how Technical Analysis and On-Chain Analysis should work in 2021, by combining both metrics into a single, easy-to-use trading indicator. In this article, we go through how the Ivan on Tech BSI Indicator works and how you can use it to anticipate moves in the crypto market.
Both Technical Analysis and On-Chain Analytics can already provide you with a substantial advantage over other traders. However, combining Technical Analysis with On-Chain Analytics is the real breakthrough innovation here. The Ivan on Tech BSI Indicator is a one-of-a-kind trading indicator and allows you to get exclusive insights into the crypto market before everyone else.
Why Do You Need The BSI Indicator?
Consequently, you need the BSI Indicator if you want to make sense of the cryptocurrency markets, understand buy and sell signals before other traders, or simply to get an edge when it comes to investing. If you use the BSI Indicator successfully, you can avoid some of the most common trading pitfalls.
For example, with the BSI Indicator, you can manage to ride the full parabolic bull market without selling too early. Conversely, constantly having access to relevant trading data means that you are well-informed, and you subsequently won’t run the risk of selling at the bottom of the market. Also, the BSI Indicator will likely quickly replace your other TA indicators. Although you could never have access to too much information, most people find that the BSI Indicator offers all the functionality and metrics they need to customize their trading strategies. This BSI Indicator review by Moneyminds gives even more insight into the crypto trading indicator.
However, it is worth noting that simply getting the BSI Indicator is not the only thing you can do to increase your probability of successful trading. The simple truth is that most traders, both in the crypto and stock market, make some mistakes when trading. With that said, educating yourself regarding trading and becoming familiar with key patterns and trends is crucial to becoming a successful trader. Ivan on Tech Academy offers dozens of world-class cryptocurrency courses, including Technical Analysis and Algorithmic Trading. Join over 30,000 already enrolled students at one of the largest online blockchain academies!
Before we get into the specifics of the BSI Indicator, let us first break down the components. As we’ve previously mentioned, the BSI Indicator includes both Technical Analysis and On-Chain Analysis metrics. So, what are these, and why do they matter?
What is Technical Analysis?
Essentially, Technical Analysis is about using historical trading data, such as asset prices or trading volume, to be able to predict future market behavior. Previous market events hold a wealth of information for understanding how the market will react in future scenarios. As Mark Twain famously put it, ”history doesn’t repeat itself, but it often rhymes”. In addition to ”hard data”, such as past prices or volume, Technical Analysis also incorporates elements of quantitative analysis, market psychology, and even behavioral economics. Although this can sound complicated, it is really quite intuitive once you think about it.
Market action is generally driven by trader sentiment or the market’s emotional state. The expressions ”bullish” and ”bearish” are basically just terms for market optimism (resulting in rising asset prices) or market pessimism (falling asset prices). Market psychology largely governs how the average investor behaves on the market.
As such, Technical Analysis can help traders understand the current emotional state of the market. This means that TA can be used to gauge market participants’ feelings, which allows a trader to extrapolate the likely short-term performance of the market. Naturally, Technical Analysis can never entirely determine the future, but it can help traders discover the most likely market performance with relatively high probability.
What’s more, when you take into account that financial markets are, in the short term, generally driven by psychological factors and emotions, this type of emotional gauge becomes very important. Granted, institutional investors work hard to avoid making emotional investment decisions. However, the vast majority of casual investors do listen to their feelings when investing. As such, Technical Analysis is an important part of the BSI Indicator in that it allows users to read the market easily and predict upcoming market moves.
What is On-Chain Analysis?
On-Chain Analysis, as the name suggests, relates to examining data on a blockchain network. Instead of the more trading-driven nature of Technical Analysis, however, On-Chain Analysis focuses on blockchain-related data. This type of data can include things like transaction data, block details, or smart contract information.

As such, On-Chain Analysis can give greater details about how cryptographic assets are actually used. Although Technical Analysis is important, On-Chain Analysis can reveal e.g., who is using a certain asset, how much of it is being used, and even for what they are using it.
On-Chain Analysis has been around since 2011, and one of the most well-known Bitcoin on-chain metrics is the Network Value to Transaction (NVT) ratio. This metric, which can be compared to a traditional price-earning ratio, divides the total network value (often the Bitcoin network’s value) by the daily USD trading volume. Nevertheless, there are countless other on-chain metrics that can help traders better understand crypto assets.
The BSI Indicator brings both On-Chain Analysis and Technical Analysis to an easy-to-use Bitcoin trading indicator, giving you the ”best of both worlds”. The combination of on-chain metrics and TA allows you to get unrivaled insights into the crypto market!
Take Advantage of Volatility with BSI
The cryptocurrency market is often slammed for being relatively volatile compared to traditional asset classes. Although this statement certainly holds some credence, the vast majority of people get volatility wrong. As an investor or trader, volatility shouldn’t be seen as an enemy. Instead, volatility is what creates a lot of opportunities in markets.
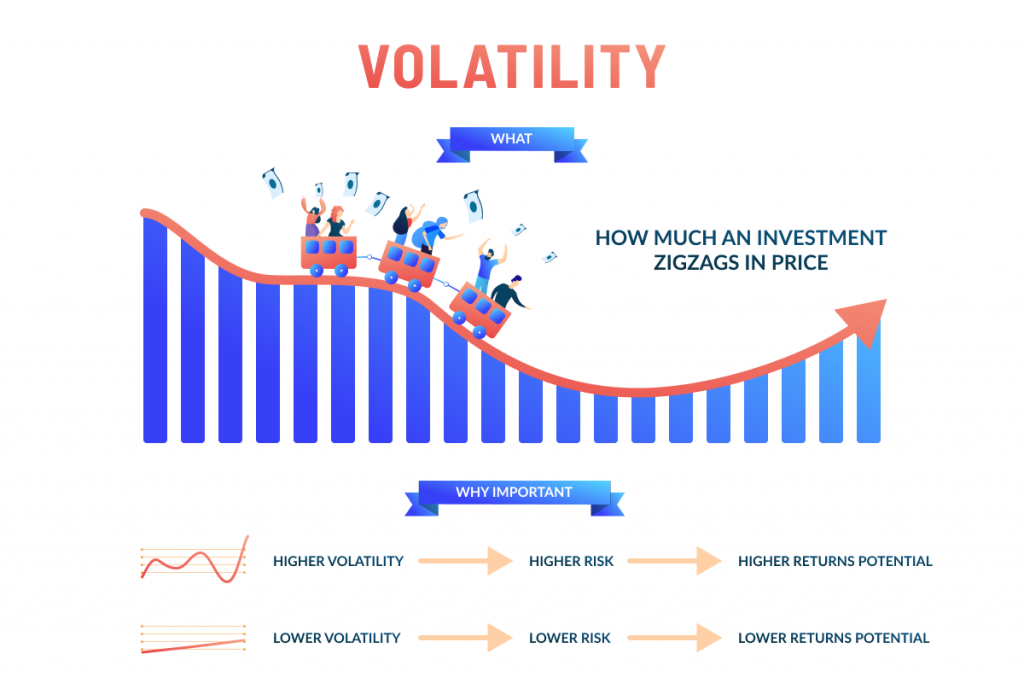
When a market is volatile, this means that there is room for gains, room for trading, and room for opportunities in the market. As such, volatility shouldn’t be seen as the enemy – rather, volatility can be an important ally and is a skilled trader’s best friend. If someone has the right tools to ride the volatility and predict the underlying mechanics driving that volatility, they can be very successful traders.
On the flip side, if a market lacks volatility, it can easily become stale. Granted, the concept of volatility can sound scary, but the lack of volatility should be even more terrifying for any driven investor. The past few months saw Bitcoin embark on a massive 2020 Bitcoin bull run, which was an excellent opportunity for traders. All bull markets are inherently volatile, meaning that those with the right tools and knowledge to take advantage of the volatility.
Take Advantage of an Immature Market
Just like when discussing volatility, the concept of an immature market can also sound worrying. However, immaturity in a market is just a sign that it is ripe for gains. So, first of all, what characterizes an immature market, and why would it be fair to say that the crypto market is still immature?

”The More Immature Market The Better”
Well, the most important factor as to why the crypto market could be called an ”immature market” is that there are a lot of people who have entered the market who have never traded in the past. What’s more, a lot of the market participants don’t know a lot about the crypto market, about the fundamentals of the market, and are uninterested in educating themselves regarding trading. This puts those who are interested in learning more at a decided information advantage. Additionally, immature investors are more likely to be governed by emotions. Incidentally, this is when Technical Analysis works the best – as the emotions are clearly seen in the charts.
When you have a highly mature market with countless sophisticated and institutional investors, these are less likely to be governed by emotions. However, emotions are one of the key market performance drivers in an immature market like the cryptocurrency market – which is why Technical Analysis lends itself so well to this.
Put simply, the newer the market, the better. Similarly, the more immature the market, the better. Growing interest in how to trade crypto in 2021 and surging interest in the crypto derivatives market suggests that retail investors are still flooding into the crypto market. As such, those with the right trading tools – like the BSI Indicator – are perfectly positioned to exceed in the crypto market.
Bitcoin Strength Index (BSI) Crypto Trading Indicator
So, which indicator works best with Bitcoin and other cryptocurrencies? If you’ve paid any attention, you will now know that the best trading indicator is the indicator that presents the most relevant information – which gives you an edge compared to other investors. The Ivan on Tech BSI Indicator ticks all these boxes. Specifically, the BSI Indicator uniquely combines both relevant on-chain data with technical analysis intelligence, giving you a comprehensive trading indicator tool.
As such, the Bitcoin Strength Index (BSI) Indicator is relatively unique on the market, as it packages both Technical Analysis and On-Chain Analysis in a single easy-to-use package. In fact, the BSI Indicator gives you three different distinct advantages that can allow you to understand the crypto markets both in the short and long term. These three main features are:
- BSI On-Chain Sentiment
- BSI Short-Term Trend
- BSI Cloud
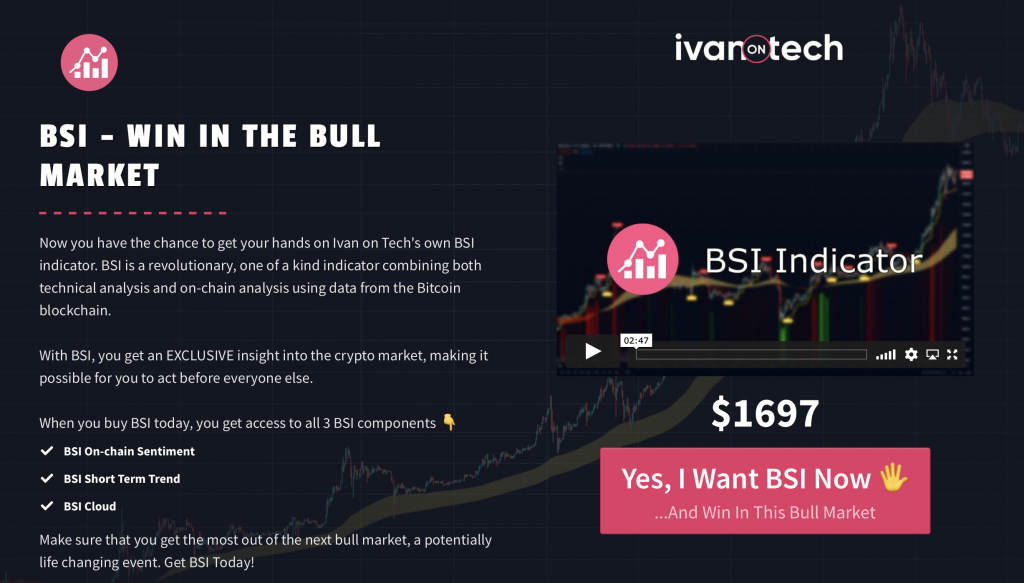
So, what do they mean? Well, first and foremost, the Ivan on Tech BSI Indicator gives you access to BSI On-Chain Sentiment, which allows you to understand what is happening on-chain before it plays out in the charts. The BSI Short Term Trend, on the other hand, allows you to see when the short-term trend switches between bullish or bearish.
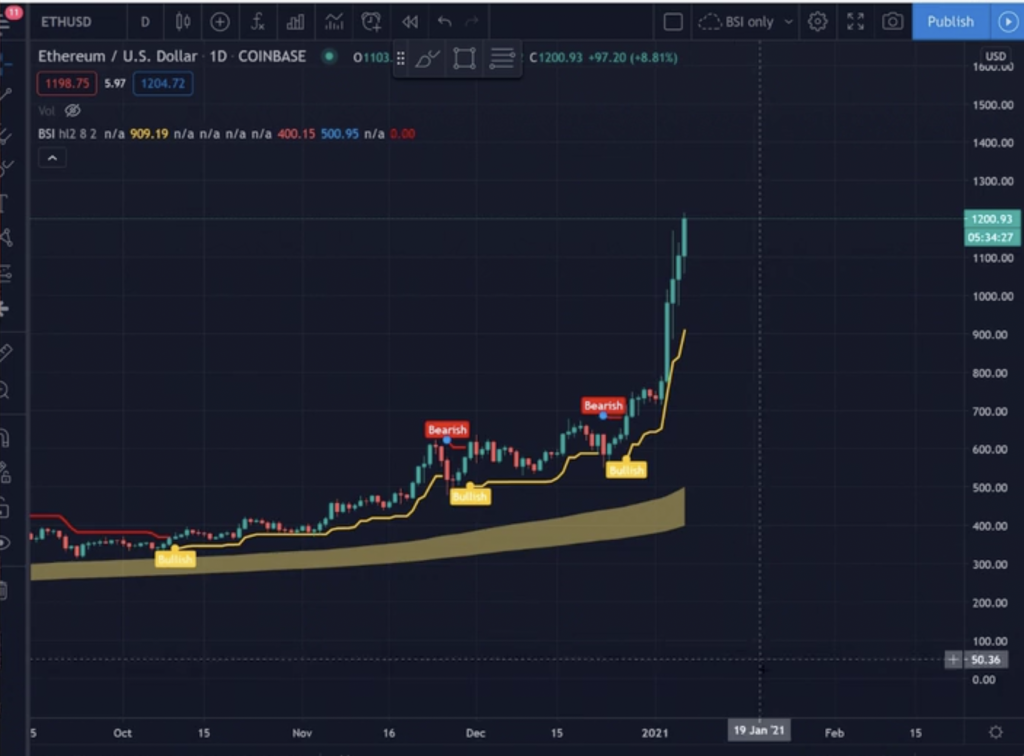
The yellow streak represents the BSI Cloud
Finally, the BSI Cloud lets you to identify long-term support in bull markets, long-term resistance in bear markets, and to understand long-term trend shifts. The BSI Indicator allows you to combine all three of these tools into a single extremely powerful Bitcoin trading indicator. Furthermore, the BSI Indicator features easy-to-use TradingView integration.
BSI’s Proven Track Record
Nevertheless, a lot of different trading indicators out there claim to be the ”only indicator you’ll ever need”. So, what sets the Ivan on Tech BSI indicator apart? Well, first of all, the BSI Indicator has a proven track record. Unlike other crypto trading indicators, the BSI Indicator consistently gives accurate signals that can allow traders to maximize the probability that their trading strategies will be successful.
Back in late 2017, at the end of the 2017 Bitcoin bull run, the BSI Indicator began to flash red, with the on-chain sentiment indicating Bitcoin was becoming overbought. Although the short-term trend was still bullish, this was a clear signal that Bitcoin was becoming dangerously overbought. Following this, Bitcoin continued to climb for 13 more days, following the bullish BSI short-term trend, before collapsing from its then-ATH of roughly $20,000. However, if you had had access to the BSI Indicator back then, you could have been aware of this impending reversal 13 days in advance!
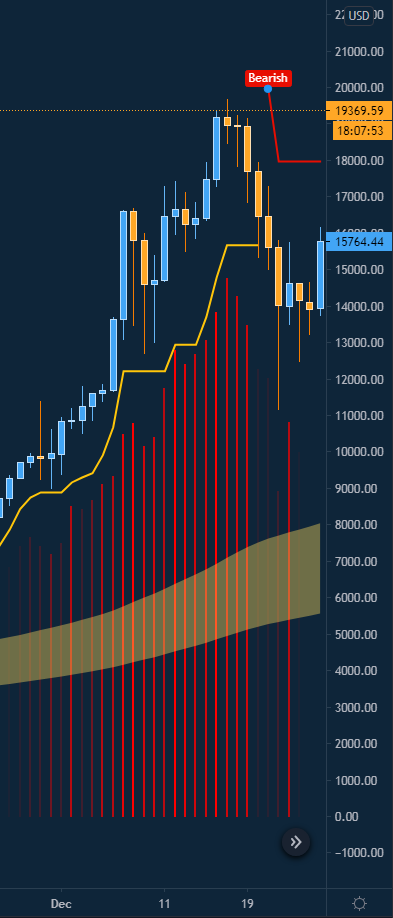
Red on-chain sentiment in late 2017 preceding Bitcoin’s bear market
Moreover, if you had the BSI Indicator in January of 2021, you would have similarly seen on-chain sentiment warning signs indicating a Bitcoin correction was likely – which happened today, on January 11th. Similarly, the BSI Indicator can also help you understand when it is time to buy, in addition to when to sell.
All in all, the BSI Indicator is not a set trading strategy. However, it is an extremely valuable information tool that allows you to make well-informed decisions and understand market performance much more precisely than you otherwise would. The BSI Indicator could be understood as giving you as a trader the knowledge of what is happening in the crypto markets. What you then decide actually to do with that information is a completely different question, and up to you. Get the BSI Indicator here!
