
So called “on-chain analysis” is an emerging field in crypto, designed to help traders enhance their strategies. By leveraging information found on the public blockchain, on-chain analysts hope to better predict future market moves. These analysts scrutinize blockchain data such as transaction details, block details, and smart contract info to gain valuable insights.
Transaction details include such things as the sending and receiving addresses and how much was sent. Block details include such items as miner rewards, timestamps, and fees. For smart contracts, on-chain analytics investigates the underlying code that controls the issuance and transfer of tokens.
If you’re a stock trader, on-chain analysis probably sounds similar to technical analysis (technical analysis). So, let’s take a look at the differences.
However, if you first want to dive deeper into the details of technical analysis, Ivan on Tech Academy offers an in-depth course covering just that subject. The Technical Analysis 101 allows you to learn technical analysis with a tried and tested online education platform. Best of all, now you get 20% when enrolling in Ivan on Tech Academy if you use the exclusive BLOG20 promo code.
On-chain Analysis vs. Technical Analysis
Early crypto traders brought their existing technical analysis tool sets with them. Now, technical analysis is largely considered to consist of the study of price action and this is still the most dominant form of analysis, even in crypto. However, with the vast amount of data available on the blockchain, a new type of analysis is emerging.
While technical analysis tracks price movements, on-chain analytics provides a more in-depth view. Analysts can dig into finding out the “who,” “what,” and “how.” Put simply, this means: Who is using a digital asset? What are they using? And how are they using it?
Take Bitcoin for example. With on-chain analytics, one can examine user adoption and miner activity. With this, they can determine whether or not the market price is justified. This is just one small use case. And while on-chain analysis fans believe it will replace technical analysis completely, many think it will at the very least complement and enhance the technical analysis’s role.
So, what does all this have to do with DeFi? We will explore that. But first, let’s look at the history of on-chain analysis and some of its present use cases.
History of On-Chain Analysis
On-chain analysis kicked off back in 2011 with the creation of the Coin Days Destroyed indicator. It was the first metric to use the age of Bitcoin addresses.
Next, CoinMetrics created the Network Value to Transaction ratio (NVT). It’s used as a way to value Bitcoin. The NVT ratio divides the total network value by the daily USD volume. And this ratio determines if Bitcoin is overvalued or undervalued. NVT became one of the first popular on-chain metrics for cryptocurrencies. It is also considered to be similar to the Price-Earnings ratio.
CoinMetrics improved the NVT ratio to provide a more accurate assessment of network value. The Network Value to Transaction ratio Signal (NVTS) includes the 90-day moving average of transaction volume.
It was dissatisfaction with holdover metrics like market capitalization (market cap) that led to the creation of other metrics. Some believed traditional market cap comparisons were misleading. That’s because cryptocurrencies behave more like money than stock.
For example, if a billion tokens were issued at $1 with 5 tokens sold, the market cap could be pitched as $1 billion. Even though the trading volume is only $5. The consensus amongst early on-chain analysts was that brute-forcing traditional metrics to fit into crypto markets was not the best solution.
New metrics were needed.
Other On-chain Metrics
Now, there are numerous on-chain metrics out there with more on the way. For this introduction, however, we will only start with a few.
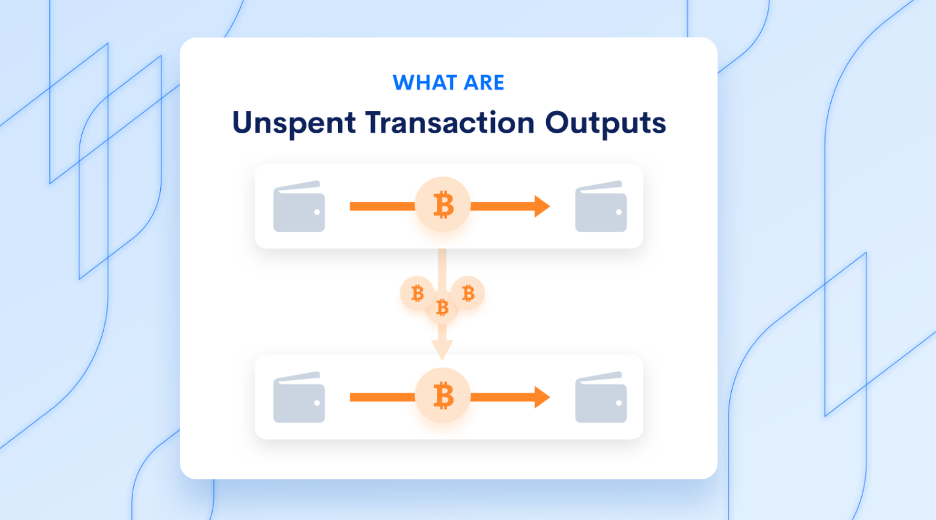
Unspent Transaction Outputs (UTXOs)
UTXO is an accounting system that tracks transactions on the blockchain with Bitcoin being the most popular. And many on-chain analytics metrics rely on them. They track UTXOs to determine when a wallet last moved its tokens. By looking at the age, size, and number of UTXOs transferred on a blockchain, analysts developed new on-chain metrics. One was called realized capitalization (realized cap). There are other on-chain indicators like SOPR or Coin Days Destroyed. They also rely on UTXOs to determine economic activity on-chain.
If you don’t understand UTXOs, please watch the Blockchain & Bitcoin 101 course at the Ivan On Tech Academy.
Realized Capitalization
CoinMetrics created this metric as a way to overcome the limitations of the traditional market cap. It operates by aggregating all the UTXOs. And it assigns a price based on the last time coins were transacted.
For example, let’s say that Bitcoin’s current price is $12k and the current supply is 18m Bitcoin. Traditional market cap analysis would multiply $12k x 18m for a total of $216b. With the realized cap metric, however, each coin would be valued based on the last time it was moved. So, if one Bitcoin was last transacted at $5k, that would be its price.
On-chain analytics counts each coin this way to determine the realized cap. And when you think about it, it is a superior way of accounting for lost coins. Let’s say that 100 Bitcoin was last moved in the year 2011. If the price of Bitcoin at the time was $1, then this group of 100 Bitcoin would be valued at $100. Traditional market cap, however, would value them at $12k x 100 or $1.2m. Unless these coins are in the possession of a “super hodler,” it’s likely they’re lost. And if they’re lost, the $100 valuation would be more accurate.
Market Value to Realized Value (MVRV)
Interestingly enough, MVRV composes both the market cap and the realized cap into its equation. CoinMetrics describes MVRV as “the ratio of a crypto asset’s market cap to realized cap.” You can think of MVRV as a comparison between hodlers and speculators.
This metric has evolved into variations such as the MVRV z-score.
How to Measure Ethereum
UTXOs are key to measuring Bitcoin. But what about Ethereum? Well, it is based on an account model, not the UTXO model. UTXO and Account-Based chains are two different accounting methods. But, they both determine the origin and ownership of coins in the network. With the account-based model, users can partially spend their balances. UTXOs, however, cannot.
For example, with 10 ETH in your wallet, you can send someone 3.5 ETH in one transaction. The result will be 6.5 ETH in your account and 3.5 in your recipient’s account. On a UTXO chain, you would have to send the full 10 BTC and receive 6.5 BTC in exchange. That would mean a separate transaction. Thus, tracking these transactions with on-chain analytics requires different processes.
On-chain Data Providers
There are two ways to collect on-chain data. You can do it yourself by running a node. Or you can go with a provider. Here is a list to start with.
This firm is best known for connecting cryptocurrencies and criminal activity. One of their products, Reactor, helps identify criminal transactions and money laundering with regards to Bitcoin. When the IRS offered a $600k plus reward to crack Monero, one can only imagine devs at Chainalysis kicking into gear.

CoinMetrics
CoinMetrics is different from Chainalysis. It offers on-chain metrics for numerous crypto assets. And their tools are best suited for crypto investors. They offer three in-house products which are:
- Network Data
Features 250+ metrics and 60+ assets
- Market Data
Covers 25+ of the top crypto exchanges along with all assets and pairs
- Indexes
Provides single and multi-asset indexes for benchmarking or financial product creation
However, to properly appreciate various crypto metrics, you first need to learn about cryptocurrencies themselves. Ivan on Tech Academy offers a Crypto Basics course that can skyrocket your blockchain knowledge in a short period of time!
Glassnode
Glassnode targets users looking to make better trading decisions. Basic on-chain metrics are free and are a great place to start. Advanced indicators, however, come with a cost.
Glassnode likes to focus on three data groupings rather than products:
- Studio
Provides graphs and charting factors like on-chain activity
- Metrics
Focuses on lots of on-chain metrics across a range of assets
- Insights
Provides reports detailing market movements
IntoTheBlock
IntoTheBlock offers a range of analytical tools for various crypto-assets. This is a newer company. However, what’s exciting about them is their interest in DeFi.
Santiment
Santiment offers an impressive suite of on-chain metrics with new ones on the way.
Criticisms of On-chain Analysis
On-chain analysis is still in its early stages, but it has drawn criticism. One has to do with the small data sets they work with. It’s not like analysts can create models based on 100 years of stock market data. There’s not even a decade worth of data to pull from in crypto. And where DeFi is concerned, some of the most popular protocols are only months old. So, small data sets pose a problem. Particularly when employing machine learning models.
Also, data quality can be a bit dicey. Especially when it comes to the order books on the exchanges. These can be full of fake volume and wash trades.
Another hazard lies in comparing on-chain metrics across multiple networks. Analysts will need to proceed carefully to avoid drawing premature conclusions. All-in-all, these factors make it difficult to develop an accurate model.
Finally, some critics are against on-chain analysis firms, period. They believe these companies undermine the spirit of crypto. With the early pioneers comprised of libertarians and crypto-anarchists, it’s easy to see how some don’t like it. Especially with companies like Chainalysis working with government officials to link individuals to blockchain transactions. It just feels like the state is preparing to drop a wet blanket on our “privacy party.”
On-chain Analysis and DeFi
So again, what does this have to do with DeFi? So far it seems that on-chain analysis is only relevant to the major cryptos like Bitcoin and Ethereum.
Presently, there doesn’t seem to be any use-cases for on-chain analysis with DeFi. However, IntoTheBlock has announced plans to deliver metrics specifically for DeFi strategies. This is great news! So let’s look at some.
On-chain Metrics for DeFi
DEXs require liquidity to provide minimal slippage. So, the best metrics to look at are:
- Total Value Locked (TVL)
DeFi requires liquidity to function properly. So TVL has been a supply-side metric. But it has limitations. For example, TVL does not necessarily equate to more users or more adoption. It could be the same amount of users are just providing more collateral. Also, the demand for incentives is likely to be far greater than the demand for the protocol. In other words, users may flock to a protocol because it offers them more candy. And not because they like it. This only incentivizes short term behavior.
- Loans Outstanding
This is a more relevant metric than TVL. That’s because it shows what the demand for the protocol’s service is. For instance, the aggregate amount of loans supplied is what would matter to the end-user.
- Volume (USD and the token)
Token supply is important because it tracks the amount supplied rather than just the USD price. Being volatile assets, USD prices can have wild swings
- Transactions
The more transactions the more liquid the protocol. The more liquid the protocol, the more seamless the trade.
- Active Users (weekly and monthly)
- Unique lenders
The unique addresses using these services over time
IntoTheBlock Insights
IntoTheBlock also has an insights section being revamped to include DeFi. This a work in progress where they aim to provide:
- a) An overview of a protocol’s use and adoption
- b) Insights about DeFi tokens
- c) Tips on usability
Also coming are analytics on:
- a) Tokens Market Cap
- b) Unique Addresses
- c) Tokens Market Share
- d) Variations between one token and another
Other topics being considered are:
- a) Liquidity pool flows within Uniswap
- b) ERC-20 to ETH flows between different tokens in the DeFi ecosystem
- c) The daily amount spent on ETH gas costs
- d) Gas costs analysis with heat maps
Conclusion
DeFi is changing the nature of finance. And we are likely witnessing the early stages of a global financial restructuring. DeFi is just starting to be usable and expectations run very high. Sure, there will be setbacks with bubbles and busts. Even Vitalik Buterin has expressed doubts about liquidity mining incentives being unsustainable. But at its core, decentralized finance could revolutionize the traditional finance sector.

If you want to learn more about technical analysis, cryptocurrencies in general or anything pertaining to blockchain technology, the Ivan on Tech Academy should be your go-to site. With over 20,000 satisfied students already enrolled, Ivan on Tech Academy is a tried and tested blockchain education platform. Perhaps most notably, you can even go from zero pre-existing knowledge to blockchain hero in a matter of weeks if you put the work in. What are you waiting for?
With potential profits looming, though, a better analytics toolset will be in demand. And new on-chain metrics will undoubtedly change the way markets are measured. For those reasons alone, on-chain analytics holds a lot of promise.
If you’re interested in on-chain analytics and want to dig deeper, you’ll first want to build a strong foundation. And for the best blockchain education anywhere, visit the Ivan On Tech Academy and get started today.
Author: MindFrac