Web3 Growth
Preface
Thank you for joining us for a special Moralis research team report. The Moralis research team specializes in deep blockchain research, heavy technicals, lengthy procedures, and expert analysis. In this report, we are adopting a different methodology as we fix our gaze on macro-trends and the social phenomenon that is Web3.
The reason for this adjusted focus is that when working as closely with blockchain technology as we do, it is easy to develop blinders, focusing only on profit goals and strategy and ignoring outsiders. While this may serve our individual strategies well, long-term growth is dependent on outside participation.
Rather than theorize on methods that can be used to promote Web3, we took a step back and started to evaluate the current state of growth within blockchain, the metaverse, and cryptocurrency (each is a contributing element to Web3). What we found was unilateral signs of growth, as Web3 blazes its own trail into the history books of technology.
Introduction to the Web3 Movement
In the realms of traditional media, Web3 (as we know it in the blockchain industry) is not yet the universally accepted “next step” for the internet. The skepticism we encounter today may bear some resemblance to the emergence of Web2 (which many were also skeptical about at the time).
True or not, this is not the focus of this report. Instead, this report serves to demonstrate the facts regarding the emergence of Web3. To do this, we will take a deep look at hard data, both on-chain and off-chain, developing together a complete picture of the thriving sophomore that is Web3.
Key Focus
This report will focus on several key areas of the emerging tech field of Web3. Web3 (as is the case with emerging tech) will continue to redefine its identity as it grows (much like was witnessed with the internet). What it will grow into is less of our focus; instead, we intend to illustrate that Web3 (a.k.a. cryptocurrency and blockchain connected applications) is growing and will continue to do so. Also, the growth we are talking about is not the responsibility or result of a single organization, nor does it resemble a social rejection of the free market; instead, it is fueled by the same spirit of choice that capitalists the world over admire.
To do this, we will independently evaluate several Web3 connected areas:
- Growing involvement by Venture Captialists.
- Growth in NFT gaming.
- Growth in the greater Ethereum ecosystem (expanded through bridges, ex. wBTC).
- Growth in Web3 revenues and fee accumulation.
- Growth in DAO involvement and proliferation.
- Growth in on-chain activity
Finally, we intend to challenge the typical model used to determine centralized vs. decentralized, implying the following question for consideration:
How should we measure centralization in light of Web3 advancement?
Here, we suggest that centralization and decentralization is a spectrum. However, in order to move fluidly through the spectrum, the technology in question must enable decentralization in some manner.
This is what we see in Web3, an emergence of a wide variety of protocols, all growing and producing a new ecosystem, capable of full decentralization and serving as a test environment for a decentralized future.
Often, the level of decentralization will vary between protocols. However, it is also common to find overlapping protocols serving similar ends within Web3. Together, the two produce a variety of routes with limited overlap on failure points.
This is apparent in Bitcoin portability, as it is possible to effectively move BTC assets to DeFi chains (such as Ethereum) and back. Were this to be provided by a single custodian or service, it would be one thing, but in practice, several protocols provide this service, perhaps most notably wrapped Bitcoin, the Ren protocol, and the Keep network.
The focus of the data and illustrations in this report is the growth of the greater Web3 ecosystem, a permissionless realm of interlocking protocols and varied levels of decentralization.
Venture Capital Entering Web3
Web3 has seen multiple interesting complaints about its funding and nature of economics. Writers from Bloomberg demonize Web3 and token-based DAOs with governance as less effective than legacy Web2 companies and equate shared protocol ownership through tokens as “communist.” There are a number of faults in these arguments.
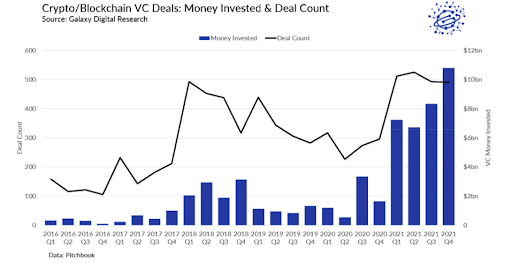
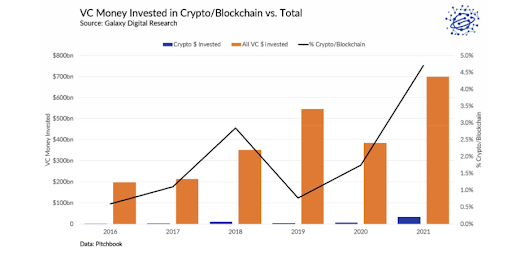
First, VCs do not agree that Web3 is “communist” and instead believe it is one of the best places for their capital allocation. Research from Galaxy Digital shows that VCs have allocated over $6B per quarter ($33.8B over the year) to crypto and blockchain-related deals. Further, 17% of this investment was specifically in Web3/DAO/metaverse related investments. Depending on the definition of Web3, all of the crypto ecosystems can roughly be placed under this bracket.
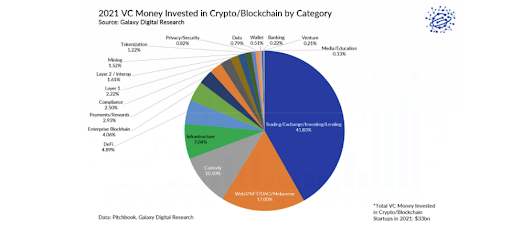
VCs are also starting to favor Web3 over traditional Web2 and legacy investments. Web3 accounted for over .2% of total VC global investment. This is compared to less than .05% in the year prior (4x increase).
Another criticism is that growth by open protocols is inferior to growth by traditional companies due to their distributed token design. The idea is that companies and capital need to be held privately to ensure the most effective growth possible. This is objectively not true as distributed networks like Bitcoin and Ethereum are amongst the highest market cap entities in the world.
Bitcoin ranks as the 9th ($814B) largest entity by market cap. This ranks higher than Berkshire Hathaway ($703B) and right below Meta ($898B). As a “network,” Meta is a good example of a global ecosystem with multi-national participation. Ethereum, in comparison, does this without permission, with a current valuation of $385B. In addition, Bitcoin has spent time higher than Tesla and Meta while Ethereum briefly passed Visa in market cap over 2021.
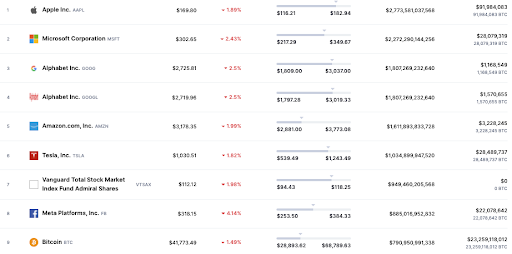
Web3 DAOs may have a lot of catching up to do to gain the size of the centralized Web2 giants; however, these decentralized organizations themselves have only existed since 2015. By often introducing fundamental network effects designed to facilitate exponential growth, centralized Web2 organizations may struggle to compete with these primitives in the future.
Forkability and Digital Ownership
Web2 platforms have a great deal of control because they have full ownership over the data on their platform. This makes it possible to port Facebook profiles or Twitter followers to other platforms.
Inversely, Web3 gives people actual ownership of their accounts and the internet. In Web3, social media profiles are tokenized and stored on the blockchain. In other words, VCs cannot own Web3 data because accounts/assets are on-chain.
VCs, however, can own the view (or front-end interface) that gives access to the blockchain. For example, OpenSea’s NFT marketplace is a Web2 platform owned by VCs that lets people see NFTs stored in the blockchain. OpenSea devs and executives have complete control over the code, not their community.
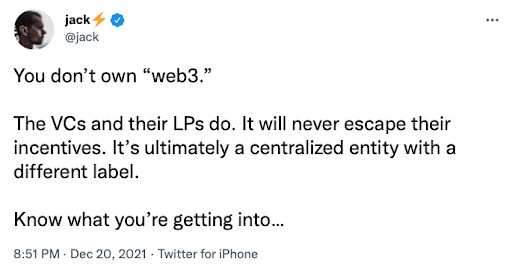
Jack Dorsey says that VCs and liquidity providers (LPs) own Web3. However, real Web3 projects are forkable. As such, communities have the power to clone projects and escape from VC orders.
For example, Uniswap’s governance is heavily under VC control. They didn’t want to issue a token and even prevented some projects from listing their tokens. As a result, the community cloned Uniswap, rebranded it as SushiSwap, and attracted Uniswap LPs with token incentives.
What this means is that while the functional entities may contain levels of centralization, this is not necessarily a permanent state, as later forks of the same technology stand to introduce improvements that increase decentralization (as this is a universally held goal for current Web3 users).
Web3 – A Democratic Distribution Strategy
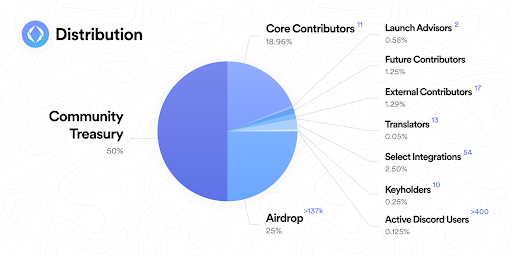
Community-based airdrops are one option for a completely democratic token system. Ethereum Name Service had one of the most prominent airdrops of 2021 with their release of the ENS token. All users who owned an ENS and used their “.eth” domain as their primary domain received a sizable ENS airdrop (between $13k-$84k). As some members of the community pointed out, this is not free money but responsibility.
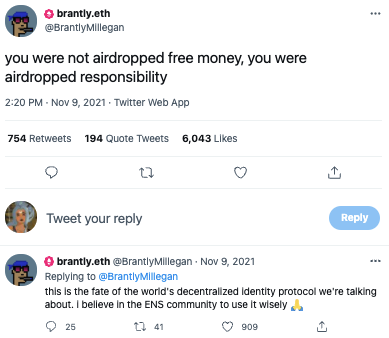
Although this statement is slightly comedic, it is grounded in some truth. ENS airdropped 25% of its governance token to its users. These users now have a greater governance share than the core contributors (with access to 18.96% of the total supply) and early participants (with access to only 6.04% of the total supply).
Growth in Web3 Networks
Moralis proudly supports more than six Web3 networks (Ethereum, Avalanche, Polygon, Fantom, Binance Smart Chain, Arbitrum, and Solana). Over the last three years, they’ve seen substantial growth. As a baseline metric, market cap will be used to show interest in Web3 infrastructure.
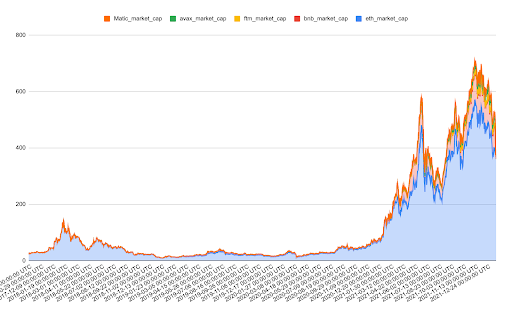
Moralis-supported smart contract platforms reached a cumulative market cap of over $700B dollars in 2021. In January 2021, the cumulative market cap was below $200B. This is an increase of over 250% in a one-year growth period.
Gaming Web3 Growth
Gaming is the biggest segment of the entertainment industry, with an estimated three billion regular participants worldwide (it’s the fastest growing and largest media/entertainment category by revenue).
The forecasted revenues for the global gaming markets in 2021 was $180.3B across console, PCs, and mobile, of which mobile comprised the largest portion at over $93B (+7.3% year over year).
The global gaming market is projected to be worth roughly $365B by 2025 – representing an increase of 16% compound annual growth rate. In parallel, the percentage of revenue generated from virtual goods purchased in games also saw an upward trend in the past decade, potentially reaching 95% of total gaming revenue in the next five years.
The traditional landscape of gaming has become dominated by pay-to-play (P2P) and in-app purchases. The value of virtual items (bought or otherwise) within games is rented out to players, exclusively restricted to only use within a specific title.
Conversely, games built to utilize Web3 technology have the ability to be 100% owned by players. The value a player generates by playing with virtual items within a game can be traded on marketplaces, peer-to-peer, or converted to real money (stablecoins, fiat, etc.). The Web3 value proposition for players is that they can now decide how to use their virtual assets on their own terms.
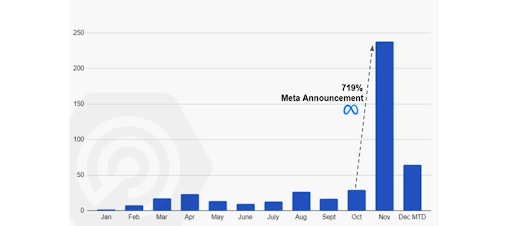
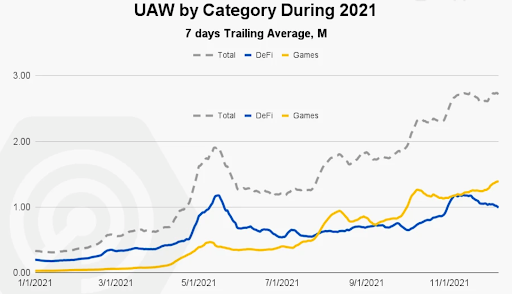
There are now 398 active blockchain games, defined as having at least one active wallet in the past 24 hours within the game; that represents a 92% increase from a year ago. The total number of blockchain games, including inactive ones, has climbed by 71% over the past year to 1,179 – the driving force behind 25% growth quarter over quarter for the blockchain industry in Q3 2021.
NFT-based titles such as Axie Infinity have focused on innovating P2E – gaining massive popularity – reaching more than 2.5 million daily users based on off-chain activity and an all-time high revenue of $364M in August 2021. Games like Axie, utilizing Web3 technology, have massive potential to drive greater player adoption and retention with the play-to-earn (P2E) model.
Total Revenue Generated
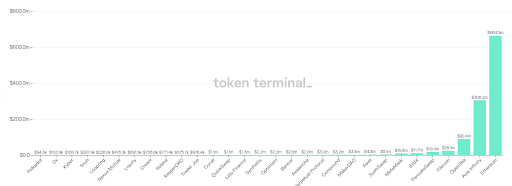
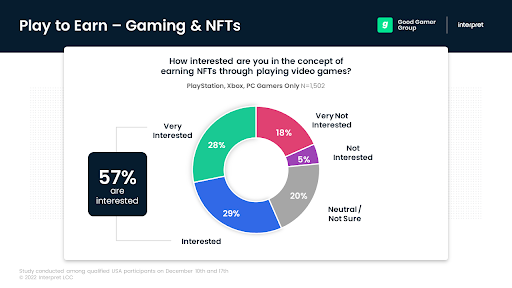
The play-to-earn gaming industry is setting itself up for hyperbolic growth. In the near future, it won’t matter on which blockchain a project launches, as its economy is always decentralized across multiple networks. Furthermore, as transactions become smoother, faster, and cheaper, users will have an improved experience and possibly won’t notice that their game runs on a blockchain. A study of 1,502 console and PC gamers found that 57% of them are interested in earning non-fungible tokens (NFTs) through gaming (survey conducted December 17th, 2021).
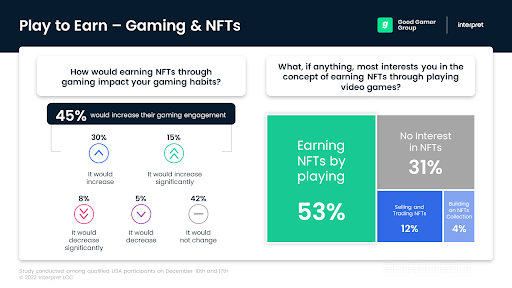
More than 50% of the entire blockchain industry’s unique active wallets were connected to GameFi (intersection of blockchain games and decentralized finance) in the second half of 2021, surpassing users in DeFi and NFTs for a total of 1.4 million. This implies a higher influx of people entering the blockchain realm and interacting with the ecosystem more than ever before.
Epic Games, one of the biggest game companies in the world, announced that it would invest $1B to build its own metaverse centered on gaming and has already stated that it’s “open to games that support cryptocurrency or blockchain-based assets.”
In an open letter, the president of Final Fantasy publisher Square Enix, Yosuke Matsuda, said that they are also exploring how to implement NFTs into its games.
The CEO of EA, Andrew Wilson, also suggested that NFTs and play-to-earn gaming are the “future of our industry.”
Without a doubt, this is a relatively new sector, and all new models, including free-to-play (F2P), pay-to-play (P2P), downloadable content, subscriptions, battle/season passes, and full digital downloads, have all been through a period of resistance. But compared to those that have come before, Web3 offers a brand new and real value proposition to players, one that has the potential to plug into exponential growth effects.
TA & On-Chain: Evidence of Web3 Growth
Retail Growth: Ethereum Wallet Balances
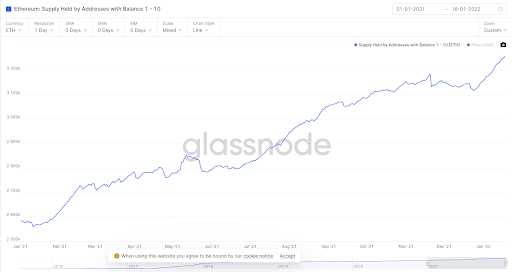
Let’s assume that a typical retail ETH hodler may hold somewhere between one and ten ETH in their wallet; we can isolate the on-chain data from these users and see on the chart below that there is consistent growth throughout 2021, including a strong rally moving into 2022 as well.
Reduction of Ethereum Centralisation?
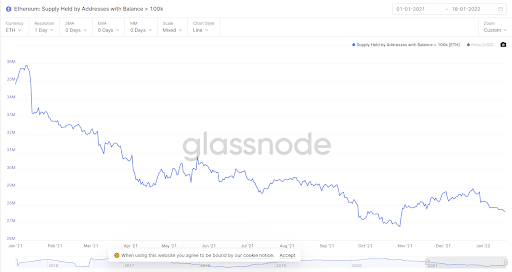
We saw a huge decrease in both the Ethereum supply held by addresses with a balance over 100k and the Ethereum percent of supply held by the top 1% of addresses suggesting that the supply is becoming more widely distributed.
Total Value Locked (TVL)
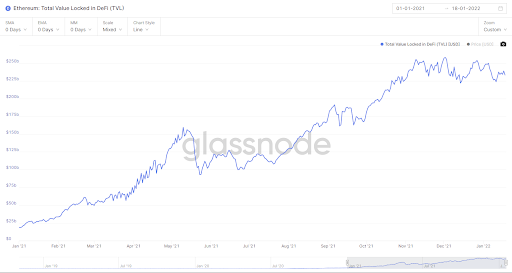
TVL in DeFi on Ethereum continues to dominate the ecosystem and reached over $250B towards the end of 2021, doubling since July and completing a 10x surge since January 2021.
Because the current L2 TVL is low, the majority of this TVL data is from L1 blockchains. At the moment, L2 protocols are still relatively new and maturing. If we attempt to anticipate the landscape, on the one hand, the ecosystem could eventually interact with Ethereum exclusively through L2s (such as zk-rollups). Or, we could find that Ethereum develops into just one of several important spheres. For example, we could have an ecosystem with Ethereum, Cosmos, Polkadot, and others, all with varied specialties, each contributing something unique. So as more data becomes available, it will be apparent to show further incredible growth here as well, and of course, we’re still very early here.
The world of Web3 is still being created and working towards its goal.
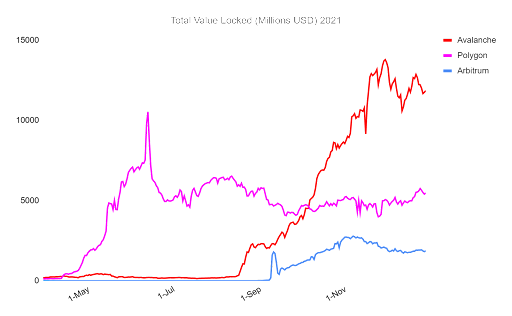
But it’s not just Ethereum that is seeing this growth. Below is a chart (including data from DeFiLlama) illustrating the TVL in millions of USD for 2021 on chains including Avalanche, Polygon, and Arbitrum, many of which had barely any value locked in 2020.
Web3 Search History
Perhaps the easiest place to start looking for growth data is Google Trends.
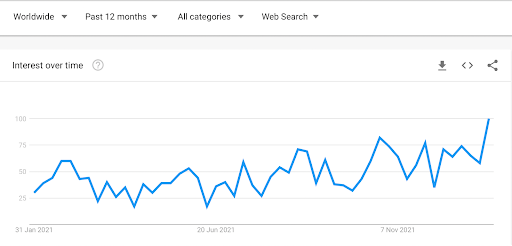
Let’s take a look at Google’s “interest over time” metric for some Web3 related topics and see if it has increased over the past twelve months worldwide. We’ll start with the term Web3 and then look at MetaMask, NFT, Solidity, and ERC-1155.
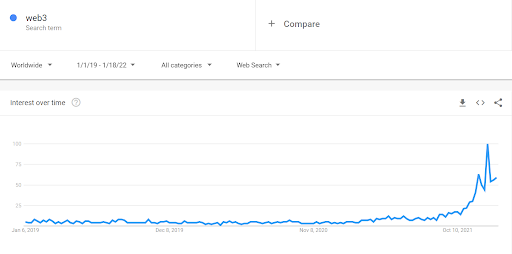
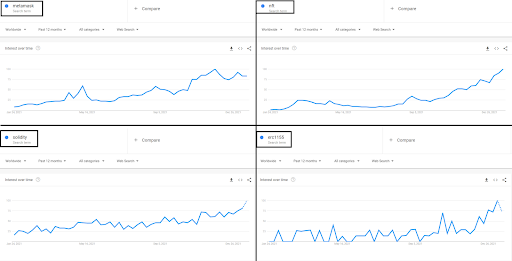
Pretty compelling results that speak for themselves; more interest and more participation mean more searches.
The Growth of BTC on Ethereum
Bitcoin is now accepted as a store of value, in part, thanks to its simple-to-understand use case. But Bitcoin’s simplicity restricts it from contributing to the more sophisticated Web3 ecosystem unless it’s bridged.
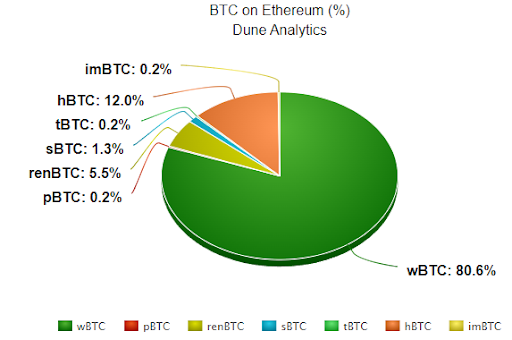
Bitcoin-Ethereum bridges allow us to move BTC from the Bitcoin network onto other networks, making it possible for BTC to interact with the entire world of DeFi on chains such as Ethereum. The trend for this activity is growing, as illustrated by the chart below, which shows the growth of bridged BTC now in the form of various tokens (wBTC [the leader], hBTC, renBTC, pBTC, tBTC, imBTC, and sBTC), all of which are now in the form of pegged tokens on different blockchains.
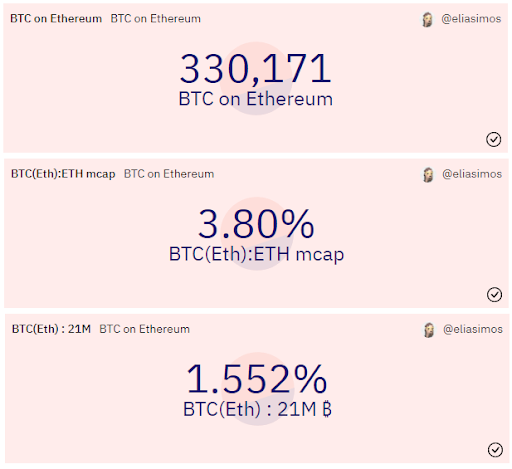
The table below the image shows the current numbers of BTC in those tokens.


Over 330k BTC now live on DeFi-enabled blockchains thanks to various bridges; approximately 1.55% of the maximum BTC supply, and their value is approximately 3.8% of the ETH market cap (at the time of writing).
The total amount of BTC locked on other chains grew exponentially in 2020 and doubled since the beginning of 2021.
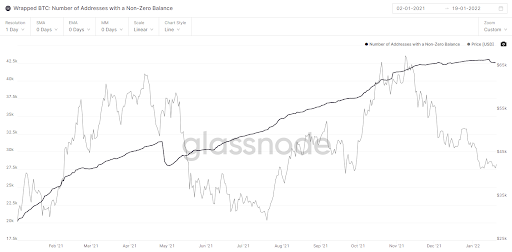
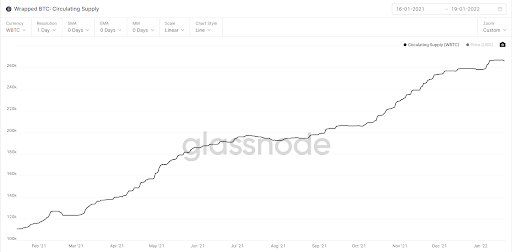
Let’s look a little deeper into wBTC by using the charts below. We can see that the number of addresses with a non-zero balance doubled during 2021 with consistent growth every month, except for around May, when the entire market experienced a heavy correction. The circulating supply increased from approximately 110k BTC to 266k BTC, highlighting the growth of users taking their BTC assets and bridging them to the Ethereum network.
Growth in DeFi Metrics
TVL and Growth
DeFi growth has many quantifiable metrics available for analysis. It is important to understand the explosion of ideas and creativity that enabled this growth. DeFi protocols are innovating and inventing new revolutionary financial products.
A sector that started with simple AMMs and collateralized lending platforms has evolved to create aggregators, options, volatility indexes, perpetual swaps, leveraged lending, forex platforms, and more. Understanding this overall growth is difficult, including key metrics such as total value locked (TVL), protocol diversity, and network diversity.
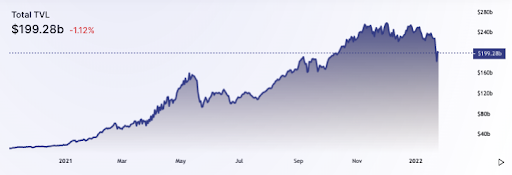
TVL has increased exponentially from the beginning of 2021. It began at $18.7B at the beginning of 2021 and currently resides at $199.3B, an increase of 965%.
The peak of value locked was in November 2021 at $258B but has retracted from these highs mostly due to the drop in ETH price over this time, making up a substantial portion of TVL.
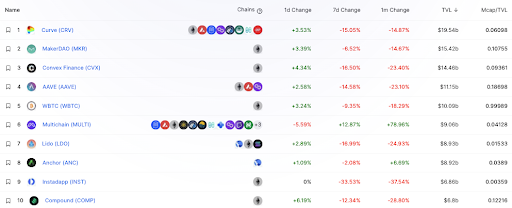
Another trackable metric is the number of relevant DeFi protocols in the space. In January of 2021, there were only 51 DeFi platforms with over $1M in TVL. This metric was available through a web archive from DeFi Pulse. Currently, DeFiLlama has 680 platforms with over $1M TVL listed. This is a 1233% increase in DeFi platforms over a one-year period. Truly a “cambrian” explosion of Web3 DeFi platforms.
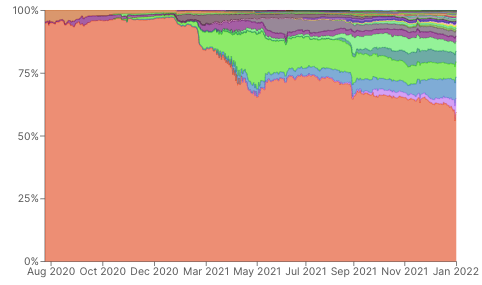
DeFi has grown exponentially in its value and diversity. Not only have the variety of platforms increased exponentially, so has their location. At the beginning of 2021, Ethereum hosted over 97% of DeFi activity on its chain. Currently, over 82 chains have over $1M of DeFi activity occurring on-chain, with Ethereum only controlling 58% of this actively.
Lending Markets
Lending markets have seen extensive growth in multiple metrics for 2021. The best metrics to comprehend growth are likely borrowing volume, competitive distribution in the sector, and revenue. Borrowing volume represents the overall usage of lending platforms. Competitive distribution represents the variety of teams and ideas involved in DeFi. Revenue represents the ability of these protocols to convert usage to protocol value. The following data was accessed on Token Terminal.
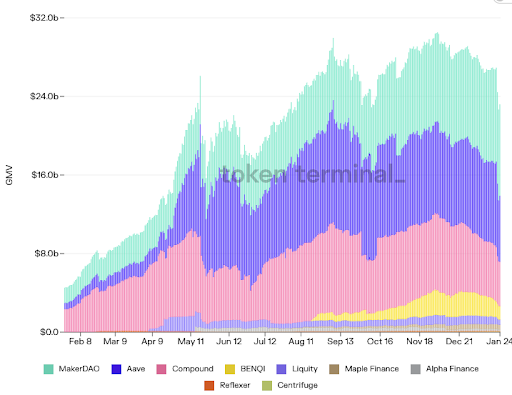
At the beginning of 2020, borrowing volume was at approximately $4.5B. The same time a year later, borrowing volume has reached approximately $26.7B, a 493% increase. Volume peaked in November at approximately $29B. Volume has seen relatively consistent growth despite a small downturn for May-July and the most recent downturn from November to the current day.
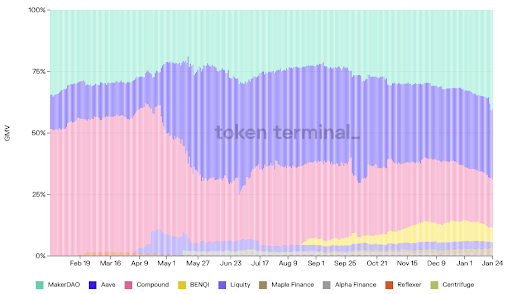
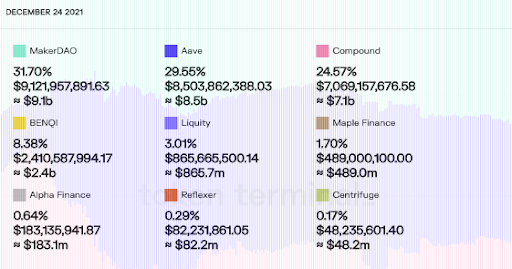
Lending markets have also grown in diversity over 2021. At the beginning of 2021, only three protocols saw over $100M of borrowing volume (MakerDAO, Compound, Aave). By the end of 2021, seven protocols had over $100M of loan volume, with several others close by. This is a 133% improvement from the start of the year.
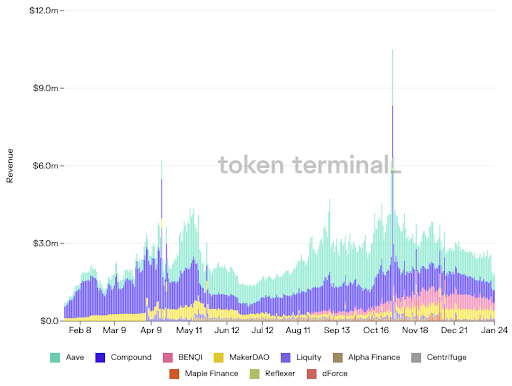
Revenue has seen less dramatic growth in aggregate (total) but still resides at levels higher than the start of 2021. Aave, Compound, and MakerDAO were making approximately $700k of daily revenue in the beginning of 2021, and increased to $2.8M of daily revenue across eight different lending platforms. This is a 300% increase in sector revenue over the course of one year.
Decentralized Exchanges
Decentralized exchanges revolutionized the crypto industry when they grew in popularity in 2020. Uniswap exceeded Coinbase in daily volume for a 24-hour period as early as September 2020. Some important metrics to observe regarding DEX growth are volume, revenue, and diversity of DEXs being used. The following data was accessed on Token Terminal.
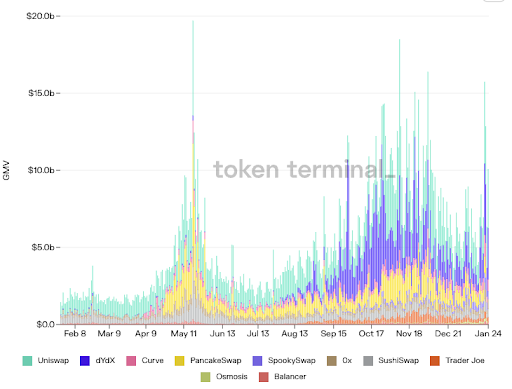
At the start of 2020, three protocols were making approximately $1.9B of 24-hour volume. A year after this point, DEXs were making approximately $10B of 24-hour volume. This is an increase of 436%. This $10B volume figure is highly variable due to market conditions but has sustained these levels for 1-2 months of total trading days.
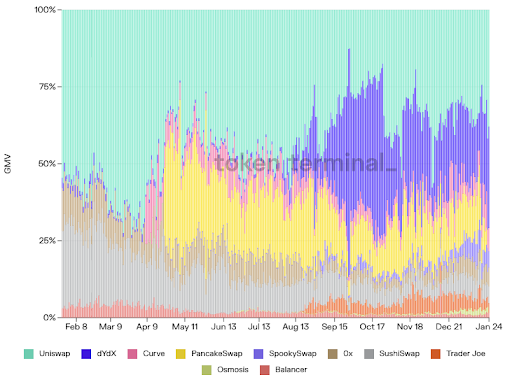
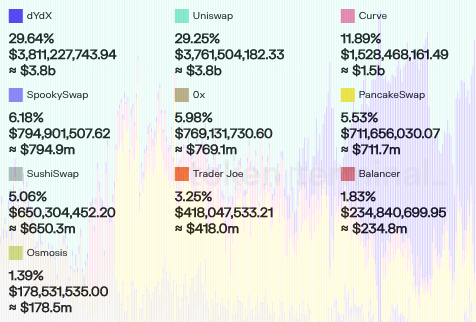
In 2021, Uniswap, SushiSwap, and the 0x exchange composed the vast majority of DEX volume. By the end of 2021, this volume was distributed across ten different relevant exchanges, an expansion of 233%.
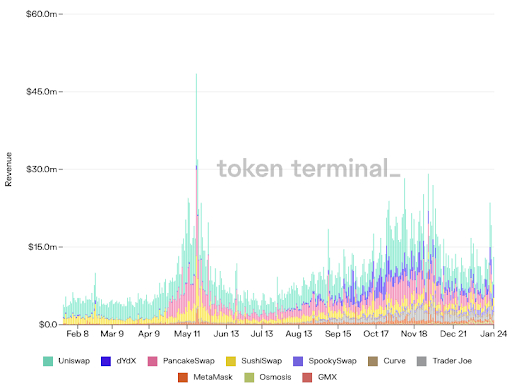
At the beginning of 2021, revenue was distributed across two primary DEXs, totaling about $4.2M of daily DEX revenue. Although the daily rate is extremely variable, overall, it has significantly increased over this time. Despite peaking in May and November, recent industry revenue is about $12.3M, an increase of 192%.
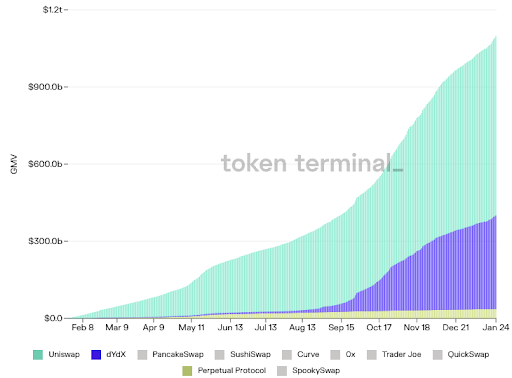
Last year, DEX subtypes were introduced. The most popular DEXs, such as Uniswap, Curve, and SushiSwap, function with an AMM-like architecture designed to trade spot tokens. Protocols such as dYdX and Perpetual Protocol offer “perpetual swap platforms” where derivatives of the underlying spot tokens are traded on the exchange. Furthermore, dYdX especially saw a rise in usage, increasing from near zero from February-May to $359.6M in volume. Comparatively, this is 52% of Uniswap’s yearly volume with less functional time. Periodically, dYdX exceeds Uniswap’s volume on a daily basis.
Growth in NFT Metrics
NFTs have been the primitive that has brought the most adoption from retail buyers in recent times. Decentralized finance, settlement layers, oracles, and other types of primitives that have a token attached to them; do not generally attract the attention of the general public, apart from the potential financial upside it could bring when considered an investment. However, NFTs have created a sense of community and belonging; retail can more easily get behind the vision as it’s a socially driven primitive in nature. Images are also easier to attach emotionally than an abstract balance in a crypto wallet. Also, many influential people discovered NFTs throughout 2021 and spread the word about them on their social media, which only popularized NFTs even more.
OpenSea, the biggest NFT marketplace, had sales volumes bigger than e-commerce platforms such as Etsy, with days that earned more than $10M in revenue, which, when annualized, give a whopping $3.65B in yearly revenue.
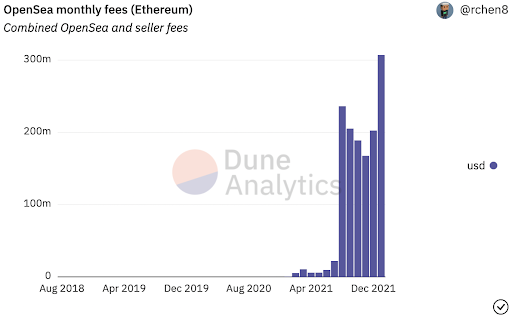
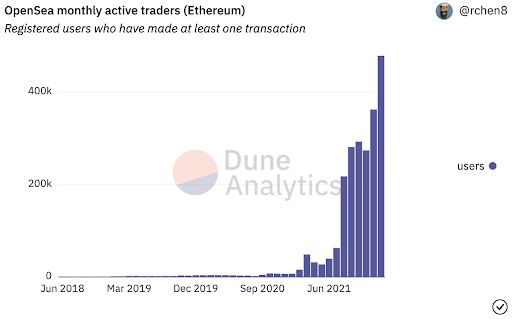
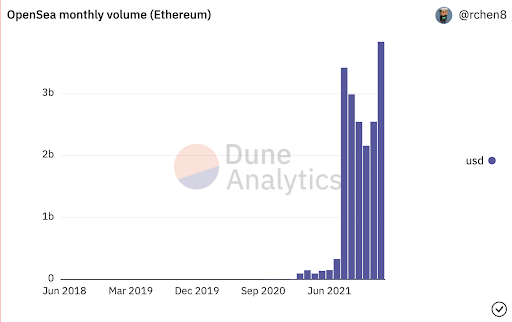
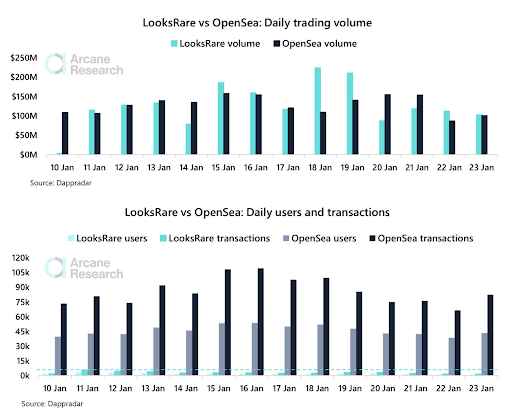
OpenSea has dominated the NFT marketplace realm and has been unchallenged for the better part of 2021, up until LooksRare launched, which is gaining traction as a more decentralized alternative to the completely centralized OpenSea platform. LooksRare launched a token that was airdropped to people according to how much trading volume they had on OpenSea from June to December in 2021. Unlike in OpenSea, where there’s a fixed 2.5% marketplace fee that goes to the company’s balance sheet, LooksRare has a 2% fee that goes to those staking the LOOKS token. This allows holders of the token to partake in the platform’s success. Many NFT community members are also commending LooksRare for their technical support activity and overall better responsiveness than OpenSea.
It has yet to be seen whether the NFT marketplace will be dominant over the coming years, but since the total addressable market is so big, it’s likely that many different teams will try to capture that growth and revenue. Notable competitors include sudoswap, which is building an NFT marketplace on top of their already existing NFT swap feature. It is a project built by 0xmons, just toby, and 0xhamachi.
If we compare volumes of OpenSea and LooksRare, we can see that LooksRare had a $4B trading volume in NFTs in the first two weeks since the marketplace went live. A lot of that trading volume spilled over from OpenSea as volume is incentivized with LOOKS rewards. To find out more, read this Twitter thread from Sofia Blikstad (Arcane Research)
NFTs are showing a strong growth trend, with many companies now creating their own solutions targeting “the metaverse.” Examples of this include Facebook rebranding to Meta and Microsoft purchasing Blizzard to create metaverse games. Furthermore, platforms such as Decentraland, The Sandbox, Somnium Space, and many others are gaining more users. NFTs are expanding to other industries such as music (Royal Markets, Audius, etc.); new use cases for NFTs are discovered in collection DAOs such as ConstitutionDAO, and much more.
NFTs are growing rapidly, with platforms such as Twitter supporting NFTs, and social media outlets like Instagram announced that added support for NFTs is coming in the near future.
There’s also a growing demand for NFTs in the gaming industry. Video game skins’ trading volume was about $15B in 2020 and around $17.5B in 2021. Most of these skins were purchasable assets only, meaning that their holders couldn’t resell them and that they could only serve as in-game modifications. If these assets were to become tradable and have scarcity mechanisms, it would create in-game economies for the exchange of these assets.
It will be interesting to see how video games will implement NFTs to improve the experience of gamers, as well as allow users to have real ownership of their in-game assets. This would be hugely beneficial instead of applying asset custody in a central database which can easily deny gamers access if their game accounts get blocked.
There’s also been a lot of pushback against NFTs in the traditional space. A lot of anti-NFT activist campaigns were led across Discord and Twitter calling NFTs all sorts of things. The main arguments in these campaigns are that NFTs consume high amounts of energy. Since most NFTs are on Ethereum, these arguments seem solid since it’s a blockchain with PoW as its consensus mechanism and is secured by miners who consume electricity to power their graphics cards. Other arguments state that NFTs have no utility, they’re overly expensive and are only used by companies and wealthy individuals to get money from less wealthy market participants, or that they are seemingly used to launder money.
One of the main arguments that we’ve seen is that you don’t really own the NFT since anyone can just “right-click-save” the image and claim that they own it. Many of these arguments stand on weak ground. However, the ones that do hold some merit (such as PoW’s huge energy consumption) are being worked on. For instance, almost every smart contract blockchain is gradually switching to PoS or already runs on it (or on BFT consensus).
Another big pain point for NFT adoption is scalability. Currently, most NFT activity is on Ethereum, and since Ethereum’s gas prices have been soaring for the entirety of 2021, they’re often pricing out the participants with small balances, which is the majority of the potential user base and addressable market. That’s why the NFT scene on alternate L1s with cheap block space has had some success in the NFT domain. Two good examples are Solana with Solanart and Tezos with HEN, which both got a fair amount of traction from retail users. The BSC ecosystem also had a fair amount of NFT activity, especially from the Asian demographic, since most BSC users come from China and neighboring countries.
As blockchains scale with solutions like optimistic rollups, zk-rollups, validiums, and volitions, it will greatly decrease the cost of purchasing and trading NFTs, which will bring the barrier to entry even lower and will expand the possible applications. A good example of how NFTs are scaling today is Immutable X, a volition L2 built and maintained by StarkWare along with the Immutable X team. To learn more about Ethereum’s modular design, rollups, and how Immutable X works, you can refer to the “ultimate guide to L2s on Ethereum” article, written by our in-house Moralis researcher DCBuilder.
NFT gaming seems to be slowly picking up, and we saw the potential of what GameFi can do with the rise of Axie Infinity, an NFT-enabled game where you can battle these small pets called “Axies.” The player communities come from all around the world and sometimes from impoverished countries, such as the Philippines, where playing Axie Infinity has become a viable career as the income from playing the game is often higher than the average worker’s salary in the country.
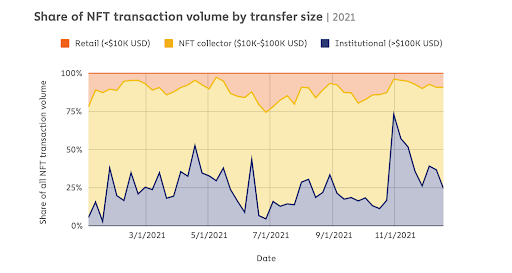
We can also see that most NFT volume happens in a transaction size range of $10k-$100k. This is due to the fact that most NFTs right now are mostly collectibles with a rarity aspect attached to them. As more utilitarian NFTs appear inside of games, in ticketing applications, and the technology scales and provides bandwidth for cheaper and more resource-intensive apps, then most of the transaction volume will happen in a far lower size range.
Part of the reason behind the explosion of NFTs is that many celebrities and wealthy individuals from the non-crypto world entered the NFT space and started collecting expensive pieces alongside wealthy crypto investors. In turn, they’re driving up floor prices across the most popular collections. This created a wave of speculation, which many investors took part in. Many collections and projects provide different forms of utility to holders besides rarity. Many build communities, help organize in-person events, give access to other NFT drops and work on innovative ways to provide value to holders.
As NFTs permeate into more and more people’s minds through adoption in different applications, in social media, and it becomes a primitive used by nearly everyone, the total addressable market cap will only grow. Whether it is the royalty-based market with art, music, cinema, writing, etc., or in instances like ticketing, proof of attendance, membership access, gaming, communities, governance, and many other use cases yet to be invented or transformed into NFTs; the growth is certain.
Growth in DAOs
DAOs are a form of coordination of resources with distributed ownership and management.
Furthermore, DAOs are a global trend that has surged in number, funds raised, members, and popularity.
Number of DAOs
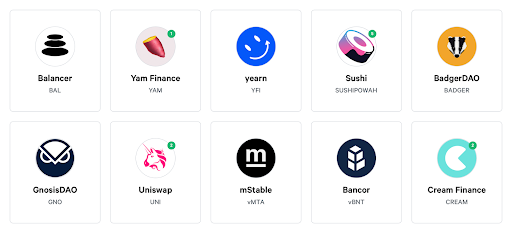
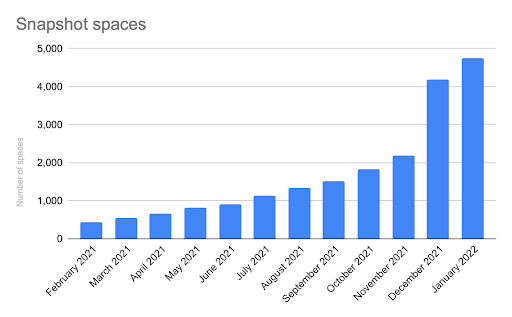
The number of DAOs increased by 10x in the last twelve months. From 448 in February to over 4,700 today.
Members
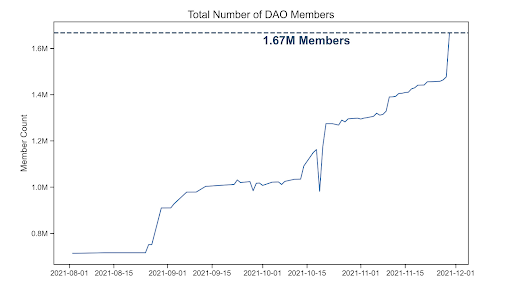
DAO members are governance token holders, and DAO memberships have exploded 130x since the start of 2021 to over 1.6M.
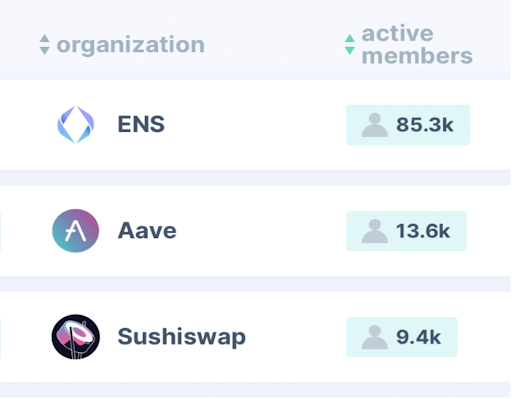
Ethereum Name Service, Aave, and SushiSwap are the top three DAOs by the number of active members who can create and vote on proposals.
DAOs Grew Rich
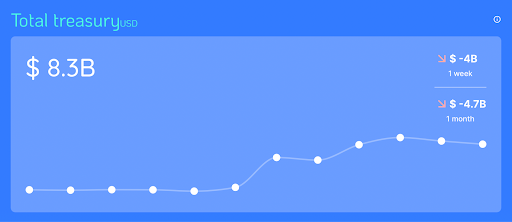
If DAOs are group chats with a shared bank account, treasuries are the bank account. Treasuries are shared wallets owned and managed by DAO members.
Treasuries increased 40x in 2021, from $400M in January to $16B by December.
DAOs Produce $
Besides billion-dollar treasuries, DAOs also are real cashflow-generating businesses.
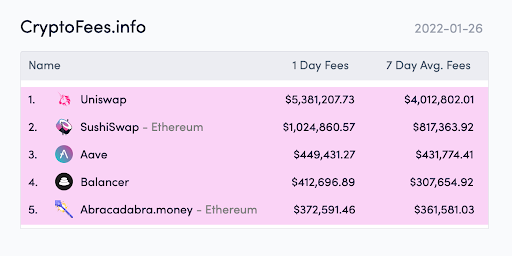
The leading DEX, Uniswap, generates over $1.4B of annualized revenue, followed by SushiSwap, with nearly $300M in yearly income.
DAOs in the Real World
DAOs used to be ignored by the outside world. The public started paying attention when DAOs became recognized by some U.S. jurisdictions and started buying the world.
Not only DAOs own magical digital property, such as cashflow-generating businesses or virtual land, but also real-world physical assets.
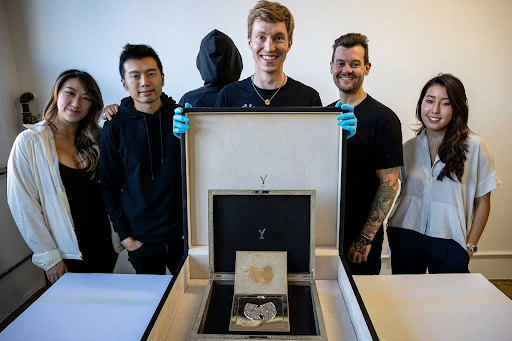
PleasrDAO purchased a rare Wu-Tang Clan album from the U.S. federal government.

Also, ConstitutionDAO, an organization that raised nearly $50M, wanted to buy a surviving copy of the U.S. constitution at a Sotheby’s auction.


Closing Thoughts
As we have illustrated, Web3 is growing, and interest in technologies that are capable of transacting in a decentralized manner is in high demand. It is this demand that fuels the interest and further development within the field of blockchain, cryptocurrency, and the ever-expanding metaverse, each an important element of Web3.
While it is sometimes easy to look at individual protocols and find flaws within the token allocation or protocol, which leads to centralized ends, the technology is being developed in order to ultimately overcome the woes of centralization.
Side note: Intentionally centralized databases follow a separate series of principles and purposefully leverage the benefits granted to a permissioned system. Incidental (temporary) centralization in Web3 projects, especially during startup, should not be confused with this, as the Web3 development process involves addressing a completely separate set of concerns. To compare the two directly (as when claiming that “Web3 decentralization is a lie”) would end in the logical fallacy of equivocation.
Interest is all that is needed because interest in Web3 is interest in a decentralized future. Decentralization, like centralization, is not an accident; it is a community effort by the free market participants looking to express their own financial interests within a fair arena. This is not to say that the arena is easy or user-friendly, nor does it need to be. Much like in traditional finance, in many cases, only seasoned professionals are equipped to excel in the most aggressive markets. This is the same in Web3.
What is being devised is not a socialist utopia but a technological world meritocracy, a world where any person can participate, not through some force of law, but through exercising their own abilities within Web3. This culture, too, is growing and is evidenced by our own Moralis Web3 framework, which now exceeds 100,000 users. Each of these users chooses Moralis because the fundamental tools provided by the architecture benefit them. Tools designed to interact not only with Ethereum but an ever-growing array of different blockchain ecosystems, each with its own security providers and beneficiaries.
People using Web3 are choosing to participate in a movement that does defy the current economic order, but it does so passively. It is not surprising that outside parties cannot see the growth that is so obvious to Web3 builders and users. Neither of these groups is liberated through Web3; they liberate themselves, Web3 is only a tool.
Much like the introduction of mass distributed electricity, the automobile, and even the internet, human systems will need to change to adapt to how Web3 is growing. New innovation does not change for the world; it is the other way around (it changes the world). If you are on the outside of new technology, then someday you’ll change to stay relevant. This is what Web3 will do.
Improvements will be made, and user-friendly aspects will be introduced. However, this movement will not change to suit most people; it will transform how most people live their lives. In the end, they will wonder how they ever lived without it.
