September 30, 2022
Moralis powered Dapps Part 1
Introduction

Welcome back everybody. It’s been another exciting week in crypto and we’re pleased to bring you the next edition of The Blockchain Review. With September almost complete and looking like a negative month for BTC and the crypto market in general, then what do we have to look forward to in October?
As we highlighted earlier in the month September is traditionally a bad month for the Bitcoin price and barring any last minute pumps, 2022 has continued the trend. September is also historically a bad month for stock markets in general and this year was no exception.
By comparison October has been good for the Bitcoin price in 8 out of the past 12 years so there’s more hope that the price will finish in positive territory by this time next month. These are just statistics though and in reality the price could go either way. The macroeconomic situation is still very uncertain and there’re also no guarantees on monetary policies going forward.
Due to the correlation, we often look to US TradFi markets for insight on how Crypto markets will behave. But as we’ve seen in Japan and the United Kingdom recently, central banks will quickly step in to intervene to support their own currencies should the unexpected happen.
In the UK a surprise budget from their new Prime Minister spooked markets and the Bank of England were forced to respond with a quick print of £65B of currency to try and settle things. Following the pandemic it’s been a unique few years and the unprecedented money printing combined with stop/start lockdowns and supply chain disruption has confused traditional economists.
Some economists think inflation has already peaked and the FED won’t hesitate to quickly pivot their policy, reduce interest rates and start the money printer back up. But rather than hinge all our hope on a FED pivot we’re better to look at other ongoing major developments as a sign that the blockchain industry is continuing to innovate and other industries are looking to take advantage.
Meta has just started allowing Facebook and Instagram users in the US to view, post and share their NFTs minted on Ethereum, Polygon and Flow. This can be done via a range of wallets. Users may or may not want to connect their Web3 wallet to Web2 social media, but it represents a gateway to further social promotion of decentralized NFTs and mass market adoption.
Telefonica, a huge multinational telecoms company in Spain has enabled payments with a range of cryptocurrencies. They’re also collaborating with Qualcomm Technologies to start building their Metaverse infrastructure. As one of the Top 10 largest telecom companies this is another sign of a gateway to mass market adoption.
MicroStrategy, one of the largest holders of BTC is looking to recruit a Software Engineer to build a Lightning Network based SaaS platform. The dev will be required to build innovative new blockchain based cybersecurity and e-commerce solutions for enterprise.
MicroStrategy Executive Chairman Michael Saylor is of course always bullish on Bitcoin, so that last one may be no surprise… but always remember when you look closer there’s still loads going on in this industry and the price movements don’t represent the scale of development and continued innovation that is yet to impact the markets!
We’ll always provide you with our research to help with your education. We’ll keep close track of the main developments and evolution of the niches in blockchain so that you get the best of the new knowledge. When you’ve finished reading your report then please remember to fill out the feedback form, your research is valued and we’re always open to suggestions.
With Great Respect,
Ivan Liljeqvist
Cryptocurrency Market Overview and Analysis

Technical Analysis Report September 30th, 2022 09:30 UTC
For those new to my analysis,
I do trend trading over long timeframes.
Global tech only has two outcomes: Giant success or catastrophic failure. Tech either does a 100x or goes to zero, with little in-between. Before reaching either end point, the asset price will trend for extended periods.
My process aims to give exposure during those periods of established trends. That way I can enter with more capital for any given risk, compared to a hold only approach. I don’t try to catch tops or bottoms. I don’t worry about intraday movements. My style of analysis is not suitable for day traders or range traders. When it comes to tech, the big gains come from catching big moves over long periods
of time.
This is an analysis at one moment in time. Market structure can change in an instant. When presented with new information,
I will adjust my opinion accordingly.
Disclosure: I hold Bitcoin and Ethereum exposure, both through company ownership and in my personal capacity, as ETP price tracker certificates in ISK through my bank. Technical analysis of historical data is neither specific financial advice for you, nor a prediction of the future. It is a tool to aid in finding setups for favorable risk-reward and points of invalidation. See website for full ToC.
Trend Analysis
(BTC) Bounce or Die...
Bitcoin is really putting up an important fight right now. The $18,600 support is key in many ways. It has been heavily defended.
- If it finally breaks, we get a continuation H&S in a solid downtrend. Then we can probably look forward to significantly lower prices.
- If it holds and breaks above the right shoulder at $22,600, we get a fulcrum bottom, a powerful bottom in the chart and it won’t take much to turn the trend back up for a real rally.
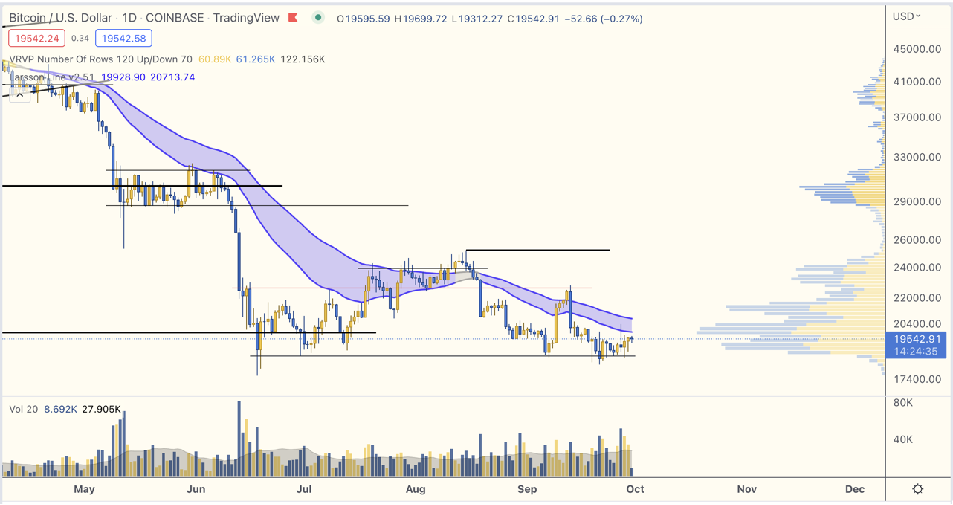
BTC/USD, daily candles
The risk appetite in the markets right now depends almost solely on DXY.
While it faced resistance over the past couple of days and retraced, the parabola is still intact, no matter how it’s drawn.
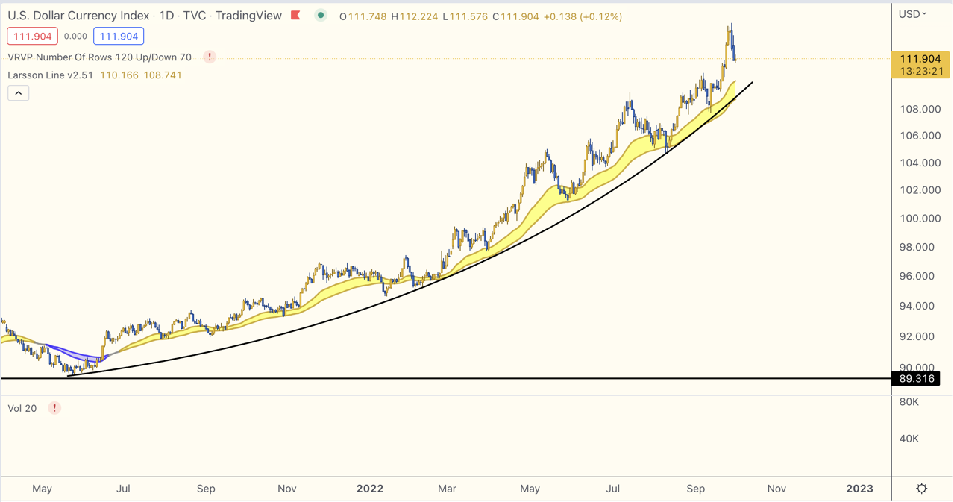
DXY, daily candles
The heavy defense of Bitcoin is apparent if we overlay BTC with the inverse of DXY:
When DXY broke down last week, Bitcoin didn’t follow. Instead it held $18,600 support.
I was almost sure BTC would break down there, but it didn’t. That is a major change.
Of course we don’t know how much ammunition the bulls have left to protect this level, but this is exciting. If DXY cools down here, we could get a rally.
But again, if $18,600 falls, better hold on to your hats folks…
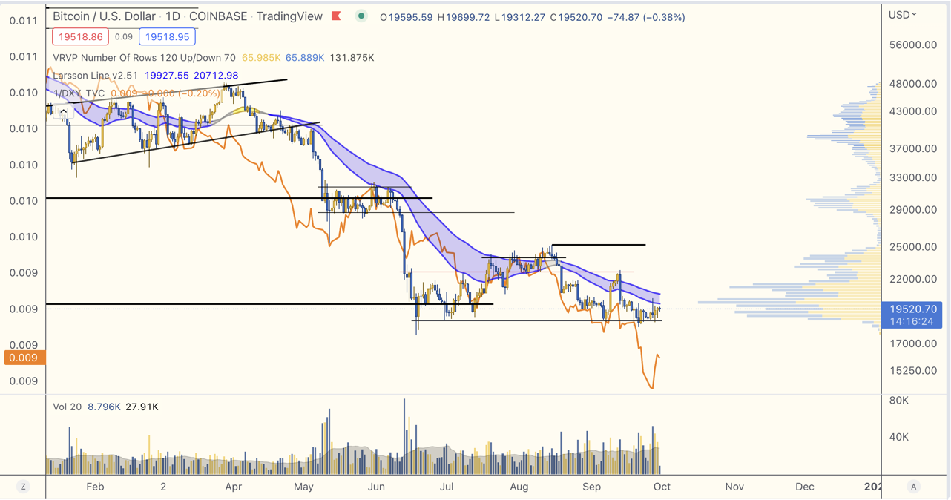
Bitcoin (candels) vs 1/DXY (orange line)
For altcoins, in this edition of the report look at the altcoin/USD charts, as many of you have requested.
The altcoin/BTC charts have not changed much from the previous edition, so you can always go back and check those, if needed.
(ETH)
As we could suspect, there’s been a sell-the-news period after the successful merge.
For now, price has held the $1272 support/resistance line drawn, but the trend has turned a solid down again.
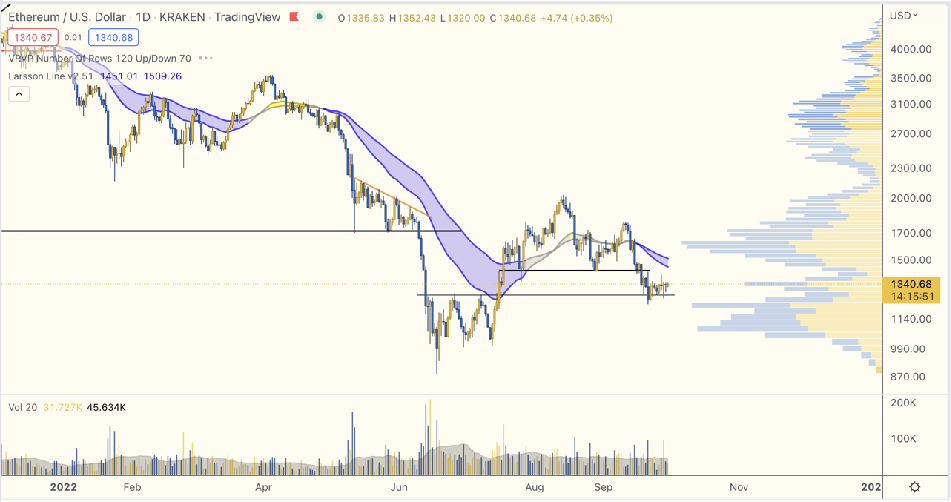
ETH/USD, Daily candles
(BNB)
While BNB/BTC looks like one of the strongest charts in all of crypto, the BNB/USD chart is far less pretty.
Price bounced up against a key support/resistance at $334 and got rejected. The trend is down on the daily timeframe.
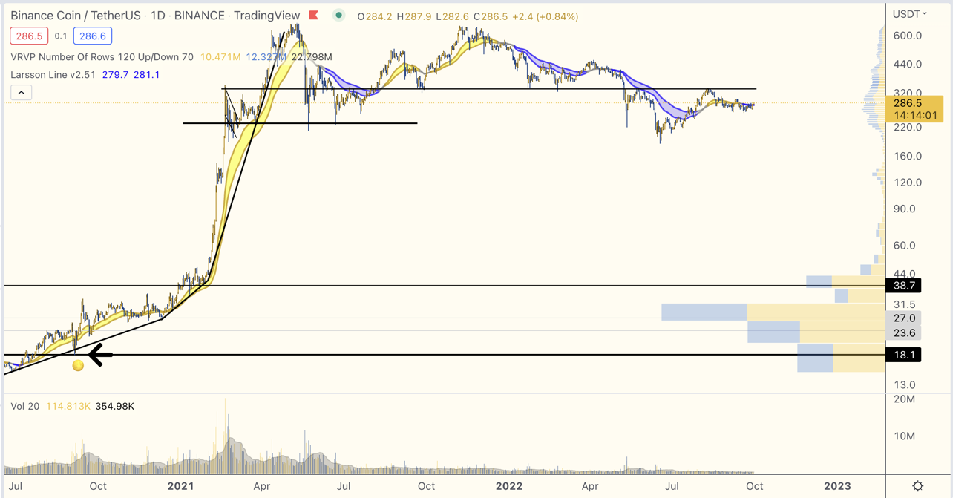
BNB/TetherUS, daily candles
(ADA)
Historically, 3 day candles have been more accurate to isolate the true underlying trend in ADA/USD than the 1 day candles. My theory is this is because of the comparably slow and steady approach to development and adoption that has always been at the core of the Cardano culture.
This chart is actually a lot clearer than the ADA/BTC chart:
The trend is solid down
Price is forming a descending triangle
Should the descending triangle confirm, i.e. break down the horizontal boundary at 0.43, that would be a confirmation for downwards continuation.
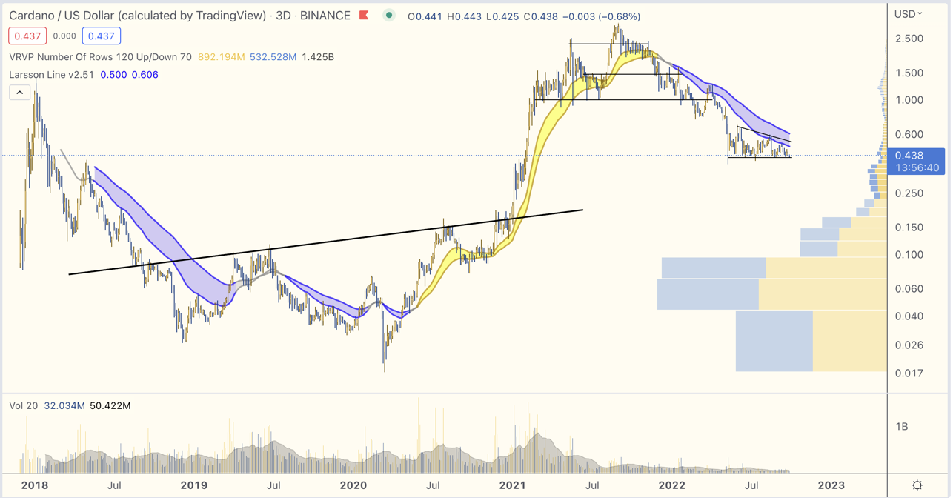
ADA/USD, 3 day candles