
Those keeping an eye on the cryptocurrency space will likely be familiar with the term “stock-to-flow model”. However, what exactly is this stock-to-flow model – and why is it important for the cryptocurrency industry as a whole? This article breaks down the stock to flow Bitcoin implications and why traders are getting so excited for stock-to-flow in the future.
Stock-to-Flow (S2F)
First and foremost, we need to look at what the Bitcoin stock-to-flow model actually is. A stock-to-flow model, or S2F model, is a technical tool that traders traditionally use. As such, stock to flow Bitcoin use-cases are, in fact, relatively new. Other scarce assets such as gold routinely use a stock-to-flow model in order to calculate price changes.
Earlier this year, stock to flow Bitcoin models became popular, due to the then-approaching 2020 Bitcoin halving event. However, understanding the stock-to-flow model is essential even when there isn’t a Bitcoin halving event approaching. Let’s see what it is and how it impacts Bitcoin!
Why is scarcity important for Bitcoin?
The goal of using a stock to flow Bitcoin model is to value Bitcoin using the crypto’s scarcity. After all, scarcity is a central part of most cryptocurrencies. Looking at Bitcoin, the premier cryptocurrency has a finite supply of Bitcoin’s.

In fact, only 21 million Bitcoin will ever be mined – and some of these will, without a doubt, disappear as wallets are lost. Or, to be more specific, no wallets are really lost, however they can become permanently locked away if the owner loses the key.
Consequently, there is no central bank that can “print more Bitcoin” like they would fiat currencies. Approximately 87.9% of all the 21 million Bitcoin we will ever see have already been issued, meaning there are just a little over 2.5 million Bitcoin left to be mined. Once the total supply of Bitcoin is gone, “that is it” – there will never be any more new Bitcoins.
As such, Bitcoin supporters argue that this gives Bitcoin an “intrinsic value”. History teaches us that scarcity is a powerful driver when it comes to determining which assets become valuable and which do not. Nevertheless, many current investors do not seem to realize the importance of Bitcoin’s scarcity fully.

The stock-to-flow Bitcoin model seeks to approximate Bitcoin’s value using the asset’s fundamental scarcity as a central element. Seeing as Bitcoin is a scarce asset, unlike traditional fiat currencies, this is an intuitive idea. As such, how does the stock-to-flow Bitcoin model actually work?
Traditional stock-to-flow models
As we’ve previously said, the stock-to-flow model is nothing new. Bitcoin is sometimes known as a “store-of-value” commodity, due to being able to retain its value over significant periods of time. However, there are many examples of these types of commodities.
The perhaps most well-known example of a store-of-value commodity is, unsurprisingly, gold. There are already parallels to be made there, seeing as Bitcoin is often known as digital gold. Nevertheless, gold is not the only example of a traditional asset using a stock to flow model to predict the asset’s value in relation to it scarcity.

Precious metals traditionally useful for stock-to-flow models
Other examples include other precious metals such as silver, copper, platinum or even oil. All of these have one central characteristic – in that their accessible supply is finite. With that said, however, some would argue that Bitcoin is even more scarce than these assets. Specifically, gold, silver or other precious metals are widely available in, for example, asteroids and other celestial bodies.
Bitcoin, on the other hand, has a mathematical and functional limitation to 21 million. When one uses the stock-to-flow model, people often look to a so-called “stock to flow ratio”. This ratio sounds can sound more complex than it actually is. In fact, all it does is to measure the total stock of a certain asset, or commodity, against the “flow” of that asset, i.e. the ongoing production.
As such, decreasing gold production, or mining, would mean that the stock-to-flow model increases, and suggests a higher price as the asset becomes more scarce. Put simply, the higher the ratio, the more valuable the asset becomes as a store-of-value asset.
Stock to flow Bitcoin
Now that we’ve gone through how the traditional stock to flow model works, we are getting ready to apply it to Bitcoin. Unlike other assets, the stock-to-flow of Bitcoin is not more or less static. Instead, this fluctuates significantly, and not only through increases and decreases in mining.

Rather, the available “flow” of Bitcoin changes dramatically through events known as Bitcoin halvings. As the name suggests, these events see the available flow of Bitcoin, or the Bitcoin mining reward, effectively cut in half.
This relatively simple concept helps promote early adoption of Bitcoin and Bitcoin mining. What’s more, it ensures that the continuous supply of Bitcoin keeps decreasing, meaning that it is not possible to flood the market with new Bitcoins as more people begin mining.
Instead, the stock to flow Bitcoin application means that Bitcoins become appreciating assets, as long as the asset retains steady interest. There have already been several Bitcoin halving events, and they take place roughly every fourth year. As such, the next Bitcoin halving event is set to take place in 2024.
Think of the “stock” of an asset as the existing “stockpile” of it, and of the flow as the continuous production. This means that the tock to flow Bitcoin ratio will keep increasing as the flow decreases, through measures such as the Bitcoin halving events. Many analysts agree that lowering the “flow” of Bitcoin like this will lead to an appreciation of the existing Bitcoins.
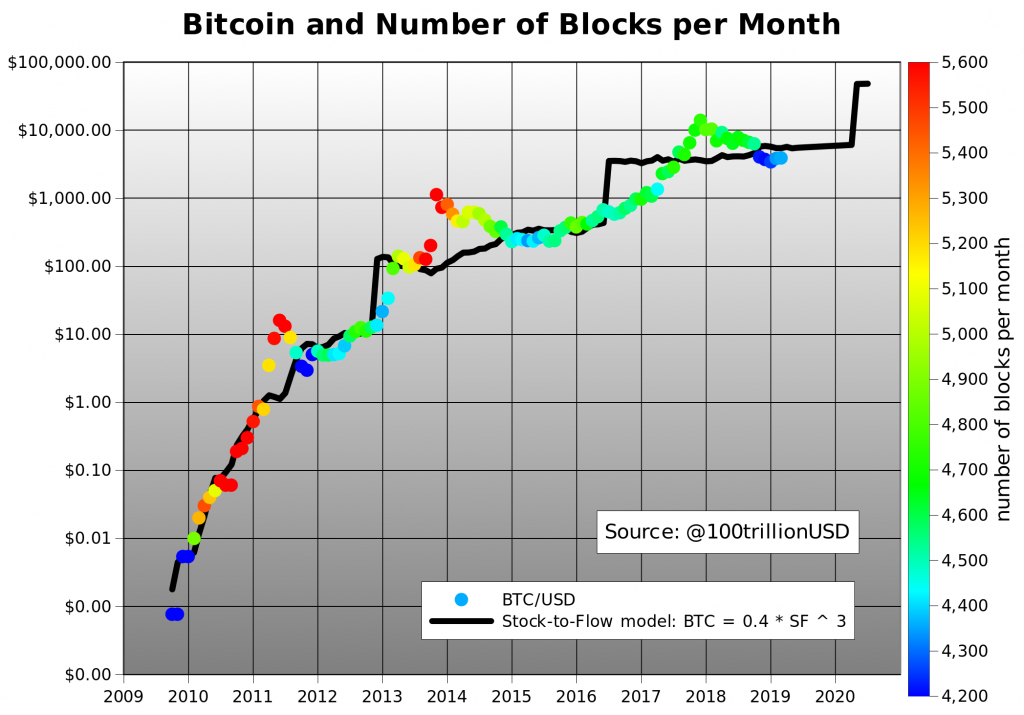
The previous rudimentary Bitcoin chart shows the stock to flow Bitcoin model, in black, and the Bitcoin price in US dollars. One can clearly see that although the relationship between the two is not perfect, the price of Bitcoin certainly follows the stock to flow ratio.
Do Bitcoin charts and Bitcoin graphs tell the truth?
Those following normal Bitcoin graphs and Bitcoin charts over the price of the premier cryptocurrency will see an explosive increase during the past few years. Specifically, the asset class’ atmospheric rise during late 2017 is especially notable. However, these Bitcoin charts and Bitcoin graphs do not tell the whole truth.
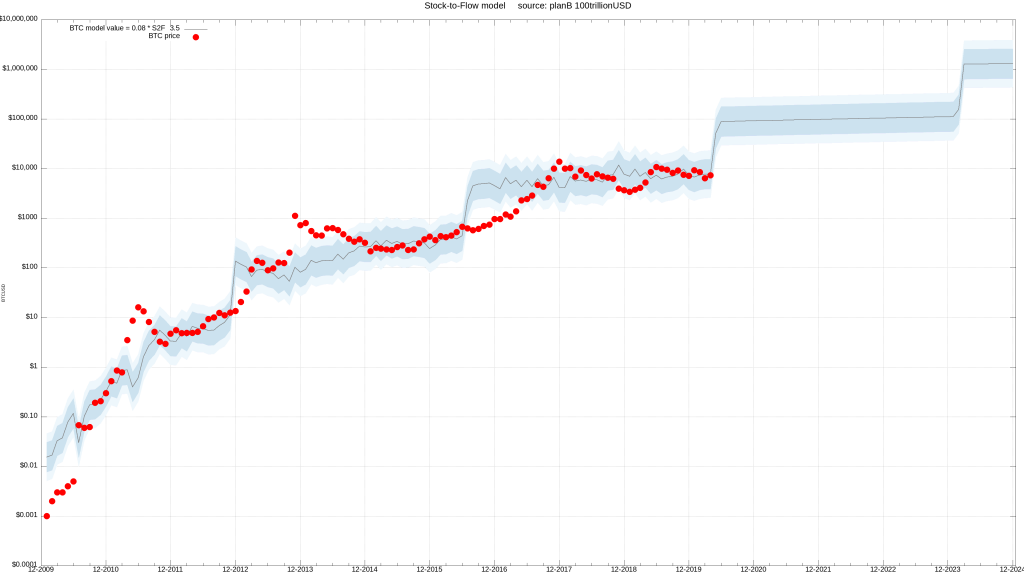
Instead, those looking to truly understand the nature of Bitcoin’s price should make sure to study the stock to flow Bitcoin model charts. These put the growing scarcity of the asset class into relation to the price of Bitcoin. Seeing the clear relationship between the two can help prospective investors get into Bitcoin, and better understand the trading mechanisms that drive its price.
As such, the answer to the common question “do Bitcoin charts and Bitcoin graphs tell the truth” is “yes, with the right context”. With that said, however, there are many different aspects of Bitcoin and the cryptocurrency world you should make sure to explore. This can seem daunting for someone with little to no experience of Bitcoin or crypto, but the solution is simple.
Ivan on Tech Academy is the go-to platform for international blockchain education and offers a wealth of content. The Academy has everything from world-class blockchain courses to helpful blockchain explainers.
Moreover, Ivan on Tech Academy also consistently produces real-life success stories – with one being the story of how an Academy alumnus recently got €1,000,000 from the EU for his WordProof blockchain project. So, why are you waiting? Sign up to Ivan on Tech Academy and go from zero to blockchain hero!